Highlights:
- Conventional hybrids are the most-driven drivetrain, averaging 14,696 miles a year and surpassing gas vehicles by 10.3%
- The Chrysler Pacifica is the most-driven gas vehicle at 20,872 miles a year, nearly 10 times the annual mileage of the Ford Mustang, the least-driven gas vehicle
- EVs are driven 10.8% fewer miles than gas vehicles, while plug-in hybrids are driven 12.5% fewer miles
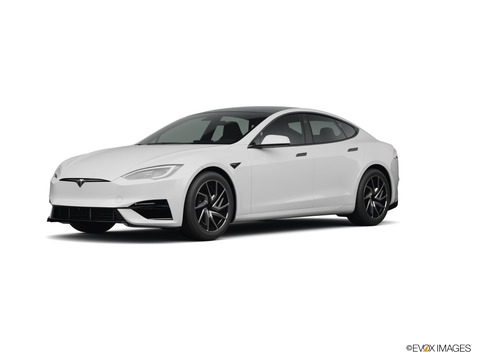
- The Tesla Model 3 and Model Y both exceed the average annual mileage for gas vehicles, making Tesla the only EV brand to accomplish this
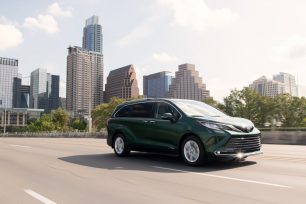
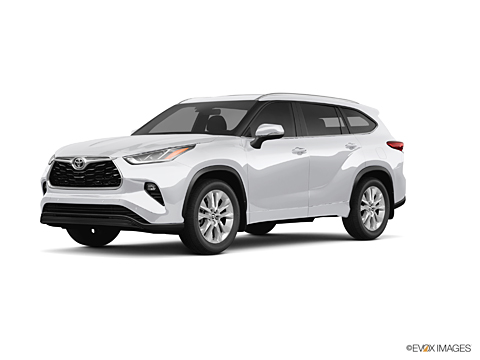
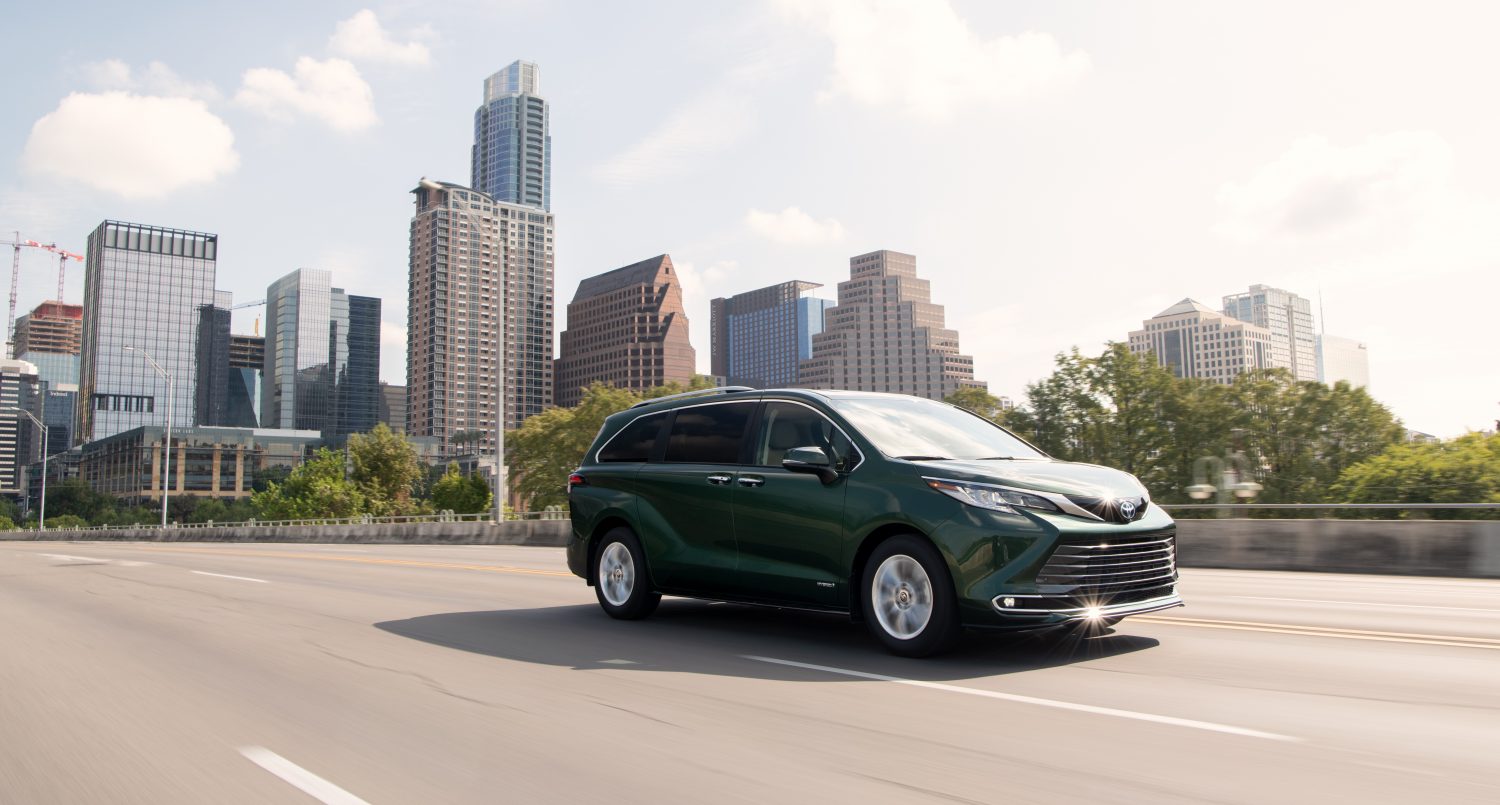
- Five of the 10 most-driven hybrids are Toyotas, including the Toyota Sienna, Highlander Hybrid, and Camry Hybrid in the top three positions
- Performance and luxury models rank among the least-driven gas and electric vehicles, including the Ford Mustang, Porsche 911, Audi RS e-tron GT, and Lucid Air
iSeeCars analyzed the odometer readings from over 2.1 million 3-year-old cars sold in 2025 to calculate the average annual miles driven by drivetrain and model. Practical family vehicles consistently rank among the most-driven models, including minivans, large SUVs, and mainstream sedans, while luxury and performance models are typically driven less.
“Gasoline models still make up the majority of vehicles in the U.S., but these rankings suggest consumers who drive a lot have embraced the higher fuel efficiency of hybrids,” said iSeeCars Executive Analyst Karl Brauer.
Conventional hybrids are driven the most
Conventional hybrids average 14,696 miles a year, the highest figure among the four drivetrain categories. They are driven 10.3% more than gas vehicles, which average 13,323 miles annually, and 23.7% more than EVs. This suggests many hybrid buyers are using their vehicles for frequent, everyday transportation while benefiting from reduced fuel consumption. It also shows that high-mileage drivers are not necessarily defaulting to conventional gas vehicles.| Annual Mileage by Drivetrain for 3-Year-Old Vehicles - iSeeCars Study | ||
| Drivetrain | Avg. Miles Driven Per Year | Compared to Gas Vehicles |
| Gas Vehicles | 13,323 | -- |
| Hybrids | 14,696 | 10.3% |
| Plug-In Hybrids | 11,660 | -12.5% |
| EVs | 11,880 | -10.8% |
Family vehicles dominate the most-driven gas models
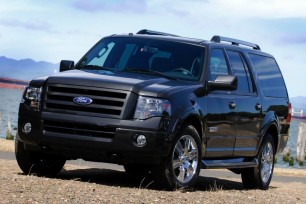
The most-driven gas vehicles are overwhelmingly built for transporting families, passengers, and cargo. The Chrysler Pacifica leads the category at 20,872 miles per year, 56.7% above the gas-vehicle average, followed closely by the Chrysler Voyager at 20,549 miles.Large SUVs also fill much of the list, including the Chevrolet Suburban, GMC Yukon XL, Nissan Armada, Toyota Sequoia, and Ford Expedition MAX. The pattern suggests vehicle function and household needs have a major influence on annual mileage.
| Top 10 Most-Driven Gas Vehicles - iSeeCars Study | |||
| Rank | Model | Avg. Miles Driven Per Year | % Compared to Average |
| 1 | Chrysler Pacifica | 20,872 | 56.7% |
| 2 | Chrysler Voyager | 20,549 | 54.2% |
| 3 | Chevrolet Suburban | 19,626 | 47.3% |
| 4 | Kia Carnival | 18,884 | 41.7% |
| 5 | Chevrolet Malibu | 18,857 | 41.5% |
| 6 | GMC Yukon XL | 18,734 | 40.6% |
| 7 | Nissan Armada | 18,098 | 35.8% |
| 8 | Toyota Sequoia | 17,856 | 34.0% |
| 9 | Ford Expedition MAX | 17,299 | 29.8% |
| 10 | GMC Sierra 1500 Limited | 17,069 | 28.1% |
| Gas Vehicle Average | 13,323 | -- | |
Sports cars and convertibles are the least-driven gas vehicles
The least-driven gas vehicles present a sharp contrast to the family-oriented models at the top of the mileage rankings. The Ford Mustang averages only 2,092 miles annually, 84.3% below the gas-vehicle average and almost exactly one-tenth the mileage of the top-ranked Chrysler Pacifica.Sports cars and convertibles occupy nearly every position, including the Mercedes-Benz SL-Class, Porsche 911, Chevrolet Corvette, and Mazda MX-5 Miata. Their low annual mileage suggests these models are frequently used as recreational, seasonal, or secondary vehicles rather than everyday transportation.
| Top 10 Least-Driven Gas Vehicles - iSeeCars Study | |||
| Rank | Model | Avg. Miles Driven Per Year | % Compared to Average |
| 1 | Ford Mustang | 2,092 | -84.3% |
| 2 | Mercedes-Benz SL-Class | 3,176 | -76.2% |
| 3 | Porsche 911 (Coupe + Convertible) | 3,850 | -71.1% |
| 4 | Chevrolet Corvette (Coupe + Convertible) | 4,394 | -67.0% |
| 5 | Lexus LC 500 (Convertible) | 4,404 | -66.9% |
| 6 | Mazda MX-5 Miata/Miata RF | 5,945 | -55.4% |
| 7 | BMW Z4 | 6,533 | -51.0% |
| 8 | Mercedes-Benz G-Class | 6,674 | -49.9% |
| 9 | Mercedes-Benz C-Class (Convertible) | 7,104 | -46.7% |
| 10 | Audi S5 (Convertible) | 7,212 | -45.9% |
| Gas Vehicle Average | 13,323 | -- | |
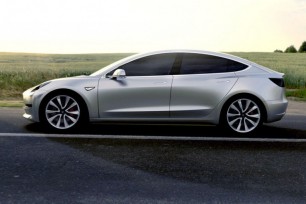
Two Teslas stand apart from other EVs
EVs average fewer annual miles than gas vehicles, but the Tesla Model 3 and Model Y are important exceptions. The Model 3 leads all EVs at 13,759 miles per year, while the Model Y follows at 13,538 miles. Both exceed the overall gas-vehicle average of 13,323 miles, making Tesla the only EV brand with models that clear that benchmark. The Hyundai Ioniq 5 is the only other EV clearly above the EV average, while the Kia Niro EV is driven essentially the same number of miles as the average electric vehicle.| Top 10 Most-Driven EVs - iSeeCars Study | |||
| Rank | Model | Avg. Miles Driven Per Year | % Compared to Average |
| 1 | Tesla Model 3 | 13,759 | 15.8% |
| 2 | Tesla Model Y | 13,538 | 14.0% |
| 3 | Hyundai Ioniq 5 | 12,271 | 3.3% |
| 4 | Kia Niro EV | 11,879 | 0.0% |
| 5 | Kia EV6 | 11,781 | -0.8% |
| 6 | Tesla Model X | 11,656 | -1.9% |
| 7 | Hyundai Kona Electric | 10,955 | -7.8% |
| 8 | Ford Mustang Mach-E | 10,914 | -8.1% |
| 9 | Chevrolet Bolt EUV | 10,783 | -9.2% |
| 10 | Nissan LEAF | 10,616 | -10.6% |
| EV Average | 11,880 | -- | |
Luxury and performance EVs are driven the least
The least-driven EVs are heavily concentrated among luxury and performance models. The Audi RS e-tron GT ranks first at 6,461 miles per year, 45.6% below the EV average, followed by the Lucid Air at 6,877 miles.The Porsche Taycan and Audi e-tron GT also appear in the bottom six, mirroring the limited use seen among gasoline-powered sports and luxury cars. This pattern suggests that an EV's market position and intended purpose may play a major role in how much it is driven.
| Top 10 Least-Driven EVs - iSeeCars Study | |||
| Rank | Model | Avg. Miles Driven Per Year | % Compared to Average |
| 1 | Audi RS e-tron GT | 6,461 | -45.6% |
| 2 | Lucid Air | 6,877 | -42.1% |
| 3 | Mazda MX-30 EV | 7,198 | -39.4% |
| 4 | Porsche Taycan (Sedan + Wagon) | 7,689 | -35.3% |
| 5 | MINI Hardtop 2 Door | 7,695 | -35.2% |
| 6 | Audi e-tron GT | 7,992 | -32.7% |
| 7 | Mercedes-Benz EQB (SUV) | 8,051 | -32.2% |
| 8 | Mercedes-Benz EQS (Sedan) | 8,271 | -30.4% |
| 9 | Rivian R1S | 8,485 | -28.6% |
| 10 | Audi Q4 e-tron | 8,567 | -27.9% |
| EV Average | 11,880 | -- | |
Toyota leads the most-driven hybrids
Toyota accounts for five of the 10 most-driven conventional hybrids, including all three of the top positions. The Toyota Sienna ranks first at 17,368 miles per year, 18.2% above the hybrid average, followed by the Highlander Hybrid and Camry Hybrid.The list is dominated by practical sedans, crossovers, and family vehicles designed for frequent daily use. Their high mileage helps explain why conventional hybrids have the highest average annual mileage of any drivetrain category.
| Top 10 Most-Driven Conventional Hybrids - iSeeCars Study | |||
| Rank | Model | Avg. Miles Driven Per Year | % Compared to Average |
| 1 | Toyota Sienna | 17,368 | 18.2% |
| 2 | Toyota Highlander Hybrid | 16,795 | 14.3% |
| 3 | Toyota Camry Hybrid | 16,605 | 13.0% |
| 4 | Honda Insight | 16,247 | 10.5% |
| 5 | Toyota Corolla Hybrid | 16,051 | 9.2% |
| 6 | Hyundai Ioniq Hybrid | 15,961 | 8.6% |
| 7 | Ford Escape Hybrid | 15,748 | 7.2% |
| 8 | Kia Sorento Hybrid | 15,365 | 4.5% |
| 9 | Hyundai Elantra Hybrid | 15,352 | 4.5% |
| 10 | Toyota Prius | 15,088 | 2.7% |
| Conventional Hybrid Average | 14,696 | -- | |
Lexus models are the least-driven conventional hybrids
Although hybrids lead all drivetrains in average annual mileage, not every hybrid covers a lot of miles. Lexus occupies the four lowest positions, led by the NX 350h at 10,312 miles per year, 29.8% below the conventional hybrid average. The Lexus UX 250h, RX 450h/450hL, and ES 300h follow, creating a clear distinction between the high-mileage mainstream Toyota hybrids and their lower-mileage luxury counterparts. This divide suggests that premium hybrid models may be used differently, or less frequently, than hybrids purchased primarily for economical daily transportation.| Top 10 Least-Driven Conventional Hybrids - iSeeCars Study | |||
| Rank | Model | Avg. Miles Driven Per Year | % Compared to Average |
| 1 | Lexus NX 350h | 10,312 | -29.8% |
| 2 | Lexus UX 250h | 10,651 | -27.5% |
| 3 | Lexus RX 450h/450hL | 11,459 | -22.0% |
| 4 | Lexus ES 300h | 12,323 | -16.1% |
| 5 | Ford Explorer Hybrid | 12,797 | -12.9% |
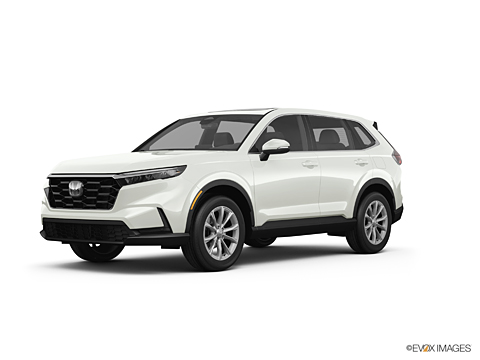
| 6 | Honda CR-V Hybrid | 12,869 | -12.4% |
| 7 | Toyota Tundra | 12,979 | -11.7% |
| 8 | Toyota Venza | 13,100 | -10.9% |
| 9 | Hyundai Santa Fe Hybrid | 13,717 | -6.7% |
| 10 | Ford Maverick | 14,060 | -4.3% |
| Conventional Hybrid Average | 14,696 | -- | |
Chrysler Pacifica Hybrid is the most-driven plug-in hybrid
Plug-in hybrids have the lowest overall annual mileage of the four drivetrain categories, but several family-oriented models substantially outperform that average. The Chrysler Pacifica Hybrid leads at 18,985 miles per year, 62.8% above the plug-in hybrid average and more than 2,100 miles ahead of the second-ranked Mitsubishi Outlander PHEV.Crossovers and family vehicles dominate the rest of the top 10, including the Kia Sorento Plug-In Hybrid, Toyota RAV4 Prime, and Hyundai Tucson Plug-In Hybrid. The results again show that practical utility can outweigh broader drivetrain trends when determining how much a vehicle is driven.
| Top 10 Most-Driven Plug-In Hybrids - iSeeCars Study | |||
| Rank | Model | Avg. Miles Driven Per Year | % Compared to Average |
| 1 | Chrysler Pacifica Hybrid | 18,985 | 62.8% |
| 2 | Mitsubishi Outlander PHEV | 16,878 | 44.8% |
| 3 | Kia Sorento Plug-In Hybrid | 14,246 | 22.2% |
| 4 | Toyota RAV4 Prime | 13,255 | 13.7% |
| 5 | Hyundai Tucson Plug-In Hybrid | 13,051 | 11.9% |
| 6 | Lincoln Aviator | 13,044 | 11.9% |
| 7 | Toyota Prius Prime | 12,999 | 11.5% |
| 8 | Hyundai Santa Fe Plug-In Hybrid | 12,866 | 10.3% |
| 9 | Hyundai Ioniq Plug-In Hybrid | 12,630 | 8.3% |
| 10 | Kia Niro Plug-In Hybrid | 12,544 | 7.6% |
| Plug-In Hybrid Average | 11,660 | – | |
Jeep Grand Cherokee is the least-driven plug-in hybrid
The least-driven plug-in hybrids include a mix of luxury vehicles and lifestyle-oriented SUVs. The Jeep Grand Cherokee ranks first at 8,435 miles annually, 27.7% below the category average, followed by the Porsche Panamera and Porsche Cayenne.Premium models from Lincoln, Audi, BMW, Lexus, and Volvo also appear in the bottom 10. The divide between these vehicles and the high-mileage Chrysler Pacifica Hybrid suggests that plug-in hybrid usage depends heavily on whether a vehicle serves as primary family transportation or fills a more specialized role.
| Top 10 Least-Driven Plug-In Hybrids - iSeeCars Study | |||
| Rank | Model | Avg. Miles Driven Per Year | % Compared to Average |
| 1 | Jeep Grand Cherokee | 8,435 | -27.7% |
| 2 | Porsche Panamera | 8,913 | -23.6% |
| 3 | Porsche Cayenne | 9,091 | -22.0% |
| 4 | Lincoln Corsair | 9,608 | -17.6% |
| 5 | Audi Q5 | 10,229 | -12.3% |
| 6 | BMW 5 Series | 10,236 | -12.2% |
| 7 | BMW 3 Series | 10,313 | -11.6% |
| 8 | Lexus NX 450h+ | 10,417 | -10.7% |
| 9 | Jeep Wrangler Unlimited | 10,616 | -9.0% |
| 10 | Volvo S60 Recharge | 10,738 | -7.9% |
| Plug-In Hybrid Average | 11,660 | -- | |
The most-driven vehicles are built for daily use
The most-driven vehicles share a common trait: they are practical models designed to handle the daily demands of families, commuters, and high-mileage drivers. Minivans lead the gasoline, hybrid, and plug-in hybrid categories, while mainstream sedans and SUVs are also driven more than average.At the other end of the spectrum, sports cars, convertibles, premium vehicles, and expensive performance models are consistently driven less, regardless of drivetrain. Even as electrified options expand across more vehicle types, how owners use a vehicle appears to matter as much as drivetrain technology in determining how far a model is driven.
Methodology
iSeeCars analyzed the odometer readings from over 2.1 million 3-year-old used cars sold in 2025. The average miles driven per year were calculated for each model as well as drivetrain, and further used to rank them. Low-volume models were excluded from the analysis.
About iSeeCars.com