Analysis of May 2020 Used Car Sales by Model, Segment, and Price
COVID-19 led to a steep decline in used car sales beginning in mid-March, but sales began to show signs of recovery in May. According to iSeeCars.com’s analysis of over 3.6 million used car sales in April and May, used car sales in April 2020 saw an overall decline of 38.4 percent over the same period in 2019, but the year-over-year sales decline in May improved to 12.5 percent. Moreover, used car sales in May 2020 grew 105.5% over April 2020. Some models, vehicle segments, and price points have rebounded faster than others--namely pickup trucks and subcompact SUVs, as well as vehicles priced under $10,000.iSeeCars analyzed the cars with the greatest growth in sales from May 2019 compared to May 2020.

| Used Car Sales in May 2020, Top Models - iSeeCars Study | |||
| Rank | Model | % Change from Last Year | % Change from Previous Month |
| 1 | Honda HR-V | 53.1% | 88.8% |
| 2 | Cadillac XT5 | 37.9% | 46.0% |
| 3 | Volkswagen Passat | 29.0% | 71.2% |
| 4 | Chevrolet Trax | 23.9% | 59.3% |
| 5 | Jeep Compass | 17.7% | 41.9% |
| 6 | Nissan Rogue Sport | 14.8% | 44.8% |
| 7 | Mercedes-Benz GLC | 14.1% | 94.9% |
| 8 | Toyota Tacoma | 13.0% | 53.7% |
| 9 | Ford F-150 | 12.2% | 49.2% |
| 10 | Jeep Grand Cherokee | 11.8% | 67.0% |
| 11 | Ram Pickup 1500 | 9.0% | 49.8% |
| 12 | Mazda CX-5 | 8.6% | 108.9% |
| 13 | Buick Encore | 7.3% | 44.6% |
| 14 | GMC Sierra 1500 | 7.3% | 41.0% |
| 15 | Chevrolet Silverado 1500 | 7.3% | 46.5% |
| Overall Average | -12.5% | 105.5% | |
Three additional subcompact SUVs make the list including the fourth-ranked Chevrolet Trax, the sixth-ranked Nissan Rogue Sport, and the thirteenth-ranked Buick Encore. “The subcompact SUV segment has seen year-over-year growth since it debuted as a segment in 2015, and these vehicles appeal to both drivers who want to enter the SUV segment and people looking to downsize from a larger SUV,” said Ly. “The Nissan Rogue Sport debuted in 2017, so 2020 marks the first year many of these vehicles are coming off-lease for the first time.”
Pickup trucks account for the segment with the most vehicles on the list with five including the eighth-ranked Toyota Tacoma, the ninth-ranked Ford F-150, the eleventh-ranked Ram Pickup 1500, the fourteenth-ranked GMC Sierra 1500, and the fifteenth-ranked GMC Sierra 1500. “Pickup trucks continue to grow in popularity, and new pickup truck sales overtook passenger cars in sales for the first time ever in April 2020,” said Ly. “This shows that pickup trucks are popular in the used car marketplace as well.”
Ranked second is the Cadillac XT-5 midsize SUV. “The Cadillac XT5 was introduced in 2017, so more off-lease models are entering the used car market,” said Ly. “The Cadillac XT5 has one of the lowest prices of all midsize luxury SUVs, so it is a popular choice for consumers who want to enter the luxury SUV market.” Another luxury SUV makes the list, the seventh-ranked Mercedes-Benz GLC. “The Mercedes-Benz GLC is the automaker’s top-selling car and is one of the best selling vehicles in its class,” said Ly.
The third-ranked Volkswagen Passat stands out as the only sedan on the list. “The Volkswagen Passat saw a 65 percent decline in new car sales in 2019 over 2018,” said Ly. “The average price of used Volkswagen Passats decreased by almost 15 percent in 2020 from the previous year, which suggests that dealers could be deeply discounting them to attract consumers.”
Two compact SUVs make the list including the fifth-ranked Jeep Compass and the twelfth-ranked Mazda CX-5. “The Jeep Compass is an affordable off-road crossover that debuted a sportier new look with its 2017 redesign, and many of these popular redesigned models came off-lease in 2020,” said Ly. “Also redesigned in 2017, the Mazda CX-5 is among the top-ranked vehicles in its class thanks to its driving performance and interior and exterior styling.”
Another Jeep model, the Grand Cherokee makes the list in the tenth spot. “The Jeep Grand Cherokee is one of the most popular SUVs, and it appeals to a wide range of consumers from sporty to luxurious with its wide range of trims,” said Ly.
Used Car Sales by Bodystyle
iSeeCars analyzed sales by bodystyle from May 2020 to compare with the previous year.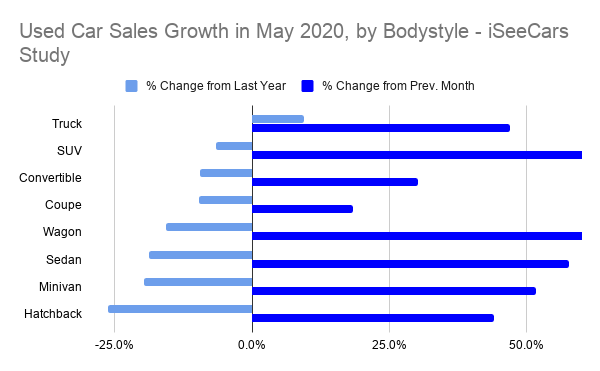
| Used Cars Sales in May 2020, by Bodystyle - iSeeCars Study | ||
| Bodystyle | % Change from Last Year | % Change Over Previous Month |
| Convertible | -9.5% | 30.3% |
| Coupe | -9.6% | 18.4% |
| Hatchback | -26.3% | 44.1% |
| Minivan | -19.7% | 51.7% |
| Pickup Truck | 9.4% | 46.9% |
| Sedan | -18.9% | 57.8% |
| SUV | -6.5% | 60.8% |
Used SUV Sales
iSeeCars analyzed the SUV segment to see which models saw the greatest growth in sales from May 2019 to May 2020.| Used SUV Sales in May 2020, Top SUVs - iSeeCars Study | |||
| Rank | SUV | % Change from Last Year | % Change from Previous Month |
| 1 | Honda HR-V | 53.1% | 88.8% |
| 2 | Cadillac XT5 | 37.9% | 46.0% |
| 3 | Chevrolet Trax | 23.9% | 59.3% |
| 4 | Jeep Compass | 17.7% | 41.9% |
| 5 | Nissan Rogue Sport | 14.8% | 44.8% |
| 6 | Mercedes-Benz GLC | 14.1% | 94.9% |
| 7 | Jeep Grand Cherokee | 11.8% | 67.0% |
| 8 | Mazda CX-5 | 8.6% | 108.9% |
| 9 | Buick Encore | 7.3% | 44.6% |
| 10 | Kia Sportage | 4.8% | 61.4% |
| 11 | Toyota 4Runner | 3.8% | 42.8% |
| 12 | Honda Pilot | 3.2% | 87.9% |
| 13 | Toyota Highlander | 2.0% | 76.6% |
| 14 | Volkswagen Tiguan | 1.3% | 66.4% |
| 15 | Dodge Durango | 1.2% | 33.3% |
| 16 | Acura RDX | 0.6% | 67.6% |
| SUV Average | -6.5% | 60.8% | |
The midsize SUVs include the eleventh-ranked Toyota 4Runner, the twelfth-ranked Honda Pilot, the thirteenth-ranked Toyota Highlander and the fifteenth-ranked Dodge Durango. “These are popular three-row family vehicles and Toyotas and Hondas are known for their long-term reliability so they appeal to practical buyers,” said Ly.
The tenth-ranked Kia Sportage, the fourteenth-ranked Volkswagen Tiguan, and the sixteenth-ranked Acura RDX round out the remaining vehicles on the list. “The Volkswagen Tiguan compact SUV is one of the most affordable three-row SUVs on the market,” said Ly. “The Acura RDX has below-average prices for the luxury segment, making it a popular choice for buyers who want to enter the luxury SUV market.”
Used Pickup Truck Sales
iSeeCars analyzed the pickup truck segment to determine which used models had the most growth in sales in May 2020 over the previous year.| Used Truck Sales in May 2020, Top Trucks - iSeeCars Study | |||
| Rank | Pickup Truck | % Change from Last Year | % Change from Previous Month |
| 1 | Toyota Tacoma | 13.0% | 53.7% |
| 2 | Ford F-150 | 12.2% | 49.2% |
| Pickup Truck Average | 9.4% | 46.9% | |
| 3 | Ram Pickup 1500 | 9.0% | 49.8% |
| 4 | GMC Sierra 1500 | 7.3% | 41.0% |
| 5 | Chevrolet Silverado 1500 | 7.3% | 46.5% |
| 6 | Toyota Tundra | 3.9% | 38.2% |
| 7 | Chevrolet Colorado | 1.5% | 33.7% |
| 8 | Nissan Titan | -1.0% | 14.4% |
Used Sports Cars Sales
iSeeCars analyzed the sports car segment to see which vehicles had the largest percent change in May 2020 versus the previous year.| Used Car Sales in May 2020, Sports Cars - iSeeCars Study | |||
| Rank | Sports Car | % Change from Last Year | % Change from Previous Month |
| 1 | Chevrolet Corvette | -1.9% | 19.2% |
| 2 | Maserati Ghibli | -2.3% | 47.7% |
| 3 | Dodge Charger | -7.6% | 25.6% |
| Sports Car Average | -7.9% | 22.0% | |
| 4 | Ford Mustang | -8.0% | 15.3% |
| 5 | Subaru WRX | -8.1% | 18.0% |
| 6 | Ford Mustang | -9.5% | 30.3% |
| 7 | Dodge Challenger | -9.5% | 22.2% |
Used Hybrid Vehicles Sales
iSeeCars analyzed hybrid vehicles to see which had the greatest growth in sales in May 2020.| Used Car Sales in May 2020, Hybrid Vehicles - iSeeCars Study | |||
| Rank | Hybrid Vehicle | % Change from Last Year | % Change Over Previous Month |
| 1 | Kia Niro | 12.4% | 58.4% |
| 2 | Toyota RAV4 Hybrid | 10.9% | 61.2% |
| 3 | Lexus RX 450h | -9.4% | 26.5% |
| 4 | Hyundai Sonata Hybrid | -13.3% | 1.1% |
| 5 | Lexus ES 300h | -23.8% | 40.7% |
| 6 | Lincoln MKZ Hybrid | -24.6% | 14.8% |
| Hybrid Average | -25.0% | 41.3% | |
| 7 | Toyota Prius | -26.4% | 41.5% |
Used Tesla Model S Sales
iSeeCars examined the Tesla Model S, a popular vehicle to compare its sales in May 2020 to May 2019.| Vehicle | % Change May 2020 vs May 2019 | % Change Over Previous Month |
| Tesla Model S | -9.4% | 43.4% |
Used Car Sales by Price Point
iSeeCars analyzed May 2020 used car sales by price to determine which price points saw the most growth.| Used Car Sales in May by Price | ||
| Price Point | % Change From Last Year | % Change Over Previous Month |
| $5,000 | 7.1% | 43.7% |
| $10,000 | 4.0% | 77.8% |
| $15,000 | -11.3% | 86.9% |
| $20,000 | -17.8% | 91.0% |
| $25,000 | -16.1% | 89.1% |
| $30,000 | -12.6% | 84.0% |
| >$ 30,000 | -11.9% | 72.5% |
Used cars for sale priced between $15,000 and $20,000 saw a 17.8 percent decline, the greatest decline of all price points in May. “This is typically a popular price point for used car shoppers, accounting for about 20 percent of the used car market, and the effect on this price point further illustrates that most consumers aren’t ready to make expensive purchases,” said Ly.
Geographic Analysis
iSeeCars analyzed the data geographically to see which metropolitan areas and states are recovering the quickest and seeing the most year over year growth for used auto sales.Used Car Sales Impact: Ranking of the Top 20 Metro Areas
iSeeCars looked at the top 20 metropolitan areas to see which areas had the biggest increase in sales in May 2020 over the previous year.| Used Car Sales in Top 20 Metro Areas, May 2020 - iSeeCars Study | |||
| Rank | Metro Area | % Change from Last Year | % Change from Previous Month |
| 1 | Phoenix, AZ | 5.9% | 61.7% |
| 2 | Minneapolis-St. Paul, MN | 0.0% | 92.4% |
| 3 | Orlando-Daytona Beach, FL | -2.8% | 79.3% |
| 4 | Tampa-St Petersburg (Sarasota), FL | -6.4% | 74.2% |
| 5 | Seattle-Tacoma, WA | -7.8% | 216.6% |
| 6 | Dallas-Ft. Worth, TX | -9.0% | 69.8% |
| 7 | Chicago, IL | -9.1% | 93.5% |
| 8 | Denver, CO | -9.9% | 106.8% |
| 9 | Houston, TX | -9.9% | 54.3% |
| 10 | Boston, MA-Manchester, NH | -11.4% | 110.9% |
| 11 | Atlanta, GA | -12.2% | 89.1% |
| 12 | Cleveland-Akron (Canton), OH | -14.8% | 61.7% |
| 13 | Washington, DC (Hagerstown, MD) | -15.5% | 105.4% |
| 14 | Detroit, MI | -18.6% | 177.1% |
| 15 | Miami-Ft. Lauderdale, FL | -19.6% | 108.0% |
| 16 | Sacramento-Stockton-Modesto, CA | -24.7% | 63.3% |
| 17 | New York, NY | -28.6% | 179.2% |
| 18 | Los Angeles, CA | -31.3% | 118.7% |
| 19 | Philadelphia, PA | -31.8% | 205.5% |
| 20 | San Francisco-Oakland-San Jose, CA | -35.1% | 101.9% |
| Overall Average | -12.5% | 105.5% | |
The metro area that was most negatively affected was the San Francisco metro area. “Despite an increase of over one hundred percent over April 2020, the San Francisco market sold well below the used cars it sold last year,” said Ly.
Used Car Sales Impact: Ranking of the Top 50 Metro Areas
iSeeCars also analyzed the used car sales data in the 50 largest metro areas.| Used Car Sales in Top 50 Metro Areas, May 2020 - iSeeCars Study | |||
| Rank | Metro Area | % Change from Last Year | % Change from Previous Month |
| 1 | St. Louis, MO | 9.5% | 66.1% |
| 2 | San Diego, CA | 9.0% | 114.2% |
| 3 | Phoenix, AZ | 5.9% | 61.7% |
| 4 | Portland, OR | 4.7% | 92.2% |
| 5 | Cincinnati, OH | 3.6% | 91.4% |
| 6 | San Antonio, TX | 2.8% | 75.1% |
| 7 | Baltimore, MD | 0.9% | 92.8% |
| 8 | Indianapolis, IN | 0.5% | 64.1% |
| 9 | Salt Lake City, UT | 0.1% | 51.9% |
| 10 | Minneapolis-St. Paul, MN | 0.0% | 92.4% |
| 11 | Austin, TX | -0.2% | 71.7% |
| 12 | Norfolk-Portsmouth-Newport News,VA | -0.5% | 90.2% |
| 13 | Raleigh-Durham (Fayetteville), NC | -2.0% | 65.4% |
| 14 | Orlando-Daytona Beach, FL | -2.8% | 79.3% |
| 15 | Oklahoma City, OK | -5.5% | 43.1% |
| 16 | Tampa-St Petersburg (Sarasota), FL | -6.4% | 74.2% |
| 17 | Columbus, OH | -6.4% | 64.2% |
| 18 | Kansas City, MO | -7.5% | 91.7% |
| 19 | Seattle-Tacoma, WA | -7.8% | 216.6% |
| 20 | Birmingham, AL | -8.5% | 68.5% |
| 21 | Dallas-Ft. Worth, TX | -9.0% | 69.8% |
| 22 | Chicago, IL | -9.1% | 93.5% |
| 23 | Denver, CO | -9.9% | 106.8% |
| 24 | Greenville-Spartanburg, SC | -9.9% | 60.0% |
| 25 | Houston, TX | -9.9% | 54.3% |
| 26 | Boston, MA-Manchester, NH | -11.4% | 110.9% |
| 27 | Atlanta, GA | -12.2% | 89.1% |
| 28 | Pittsburgh, PA | -13.4% | 103.2% |
| 29 | West Palm Beach-Ft. Pierce, FL | -14.1% | 78.7% |
| 30 | Nashville, TN | -14.1% | 64.2% |
| 31 | Greensboro-Winston Salem, NC | -14.5% | 77.5% |
| 32 | Cleveland-Akron (Canton), OH | -14.8% | 61.7% |
| 33 | Milwaukee, WI | -14.8% | 55.4% |
| 34 | Washington, DC (Hagerstown, MD) | -15.5% | 105.4% |
| 35 | Jacksonville, FL | -15.6% | 55.3% |
| 36 | Charlotte, NC | -17.8% | 73.5% |
| 37 | Detroit, MI | -18.6% | 177.1% |
| 38 | Miami-Ft. Lauderdale, FL | -19.6% | 108.0% |
| 39 | Memphis, TN | -20.2% | 49.7% |
| 40 | Albuquerque-Santa Fe, NM | -20.3% | 103.6% |
| 41 | Fresno-Visalia, CA | -21.0% | 63.0% |
| 42 | Hartford & New Haven, CT | -22.0% | 107.1% |
| 43 | Grand Rapids-Kalamazoo, MI | -23.0% | 174.2% |
| 44 | Harrisburg-Lancaster-York, PA | -23.9% | 343.0% |
| 45 | Sacramento-Stockton-Modesto, CA | -24.7% | 63.3% |
| 46 | New York, NY | -28.6% | 179.2% |
| 47 | Los Angeles, CA | -31.3% | 118.7% |
| 48 | Philadelphia, PA | -31.8% | 205.5% |
| 49 | Las Vegas, NV | -32.3% | 96.0% |
| 50 | San Francisco-Oakland-San Jose, CA | -35.1% | 101.9% |
| Overall Average | -12.5% | 105.5% | |
| Used Car Sales by State in May 2020 - iSeeCars Study | |||
| Rank | State | % Change from Last Year | % Change from Previous Month |
| 1 | Hawaii | 40.0% | 122.6% |
| 2 | Iowa | 7.9% | 55.9% |
| 3 | Idaho | 6.7% | 79.1% |
| 4 | Alaska | 6.6% | 91.2% |
| 5 | Utah | 5.7% | 52.4% |
| 6 | Arizona | 4.2% | 63.0% |
| 7 | Arkansas | 3.9% | 45.9% |
| 8 | Missouri | 2.2% | 76.8% |
| 9 | South Dakota | -0.3% | 73.9% |
| 10 | Oklahoma | -1.2% | 40.3% |
| 11 | Montana | -1.5% | 58.6% |
| 12 | Oregon | -1.8% | 78.3% |
| 13 | Maine | -3.5% | 117.7% |
| 14 | West Virginia | -3.7% | 73.3% |
| 15 | Nebraska | -3.7% | 67.4% |
| 16 | Indiana | -3.7% | 65.8% |
| 17 | Texas | -4.9% | 67.3% |
| 18 | Minnesota | -5.4% | 92.1% |
| 19 | Virginia | -5.5% | 96.1% |
| 20 | North Dakota | -5.6% | 85.6% |
| 21 | Washington | -6.0% | 199.5% |
| 22 | Kentucky | -7.6% | 113.9% |
| 23 | Delaware | -7.7% | 102.7% |
| 24 | Louisiana | -8.5% | 82.9% |
| 25 | Alabama | -8.6% | 61.8% |
| 26 | Massachusetts | -8.7% | 151.9% |
| 27 | Wisconsin | -9.2% | 69.7% |
| 28 | Kansas | -10.0% | 71.5% |
| 29 | Colorado | -10.3% | 109.2% |
| 30 | Georgia | -11.6% | 81.4% |
| 31 | Florida | -11.7% | 80.8% |
| 32 | New Hampshire | -12.8% | 43.4% |
| 33 | North Carolina | -13.3% | 70.3% |
| 34 | Ohio | -13.4% | 65.8% |
| 35 | South Carolina | -13.6% | 62.9% |
| 36 | Illinois | -14.7% | 91.2% |
| 37 | Maryland | -15.3% | 96.6% |
| 38 | Tennessee | -15.7% | 60.6% |
| 39 | Mississippi | -15.9% | 40.5% |
| 40 | Wyoming | -17.1% | 63.0% |
| 41 | New Mexico | -17.6% | 101.6% |
| 42 | Rhode Island | -21.3% | 89.8% |
| 43 | Connecticut | -24.3% | 114.6% |
| 44 | New York | -24.5% | 165.2% |
| 45 | Pennsylvania | -25.2% | 227.5% |
| 46 | Michigan | -26.0% | 192.2% |
| 47 | California | -26.9% | 101.7% |
| 48 | New Jersey | -29.8% | 175.0% |
| 49 | Nevada | -30.4% | 93.7% |
| 50 | Vermont | -31.8% | 101.4% |
| Overall Average | -12.5% | 105.5% | |
“The state with the greatest increase is Hawaii, which saw significant growth in May 2020 over the previous year,” said Ly. “The state had the largest year-over-year difference in average price, with cars bought in May 2020 on average 13.5 percent cheaper than cars bought in 2019, which suggests that more consumers are buying used cars amid the downturn and taking advantage of low prices.”
Vermont is the state that saw the greatest decline in May over the previous year. “Although May sales doubled over the previous month, the state’s historic unemployment rate likely kept consumers from buying cars,” said Ly.
When examining month-over-month changes, Pennsylvania saw the greatest change in May over April with 227.5 percent, followed by Washington at 199.5 percent. “Pennsylvania had strict orders to ban car sales until online sales were allowed in late April,” said Ly. “Washington was among the first areas to have a stay at home order, and auto dealers were under strict restrictions before opening in early May.”
“May brought significant recovery for the used car market compared to April, and some models like pickup trucks and small SUVs saw significant growth past their pre-COVID sales figures,” said Ly. “However, the effects of the economic downturn brought on by COVID-19 still remain for other vehicle segments and used cars at higher price points.”
Methodology
iSeeCars.com analyzed over 3.6 million used car sales in April and May of 2019 and 2020 to compare year-over-year and month-over-month changes in sales. Cars no longer in production as of the 2020 model year, heavy-duty vehicles, and low-volume cars were excluded from further analysis.
About iSeeCars