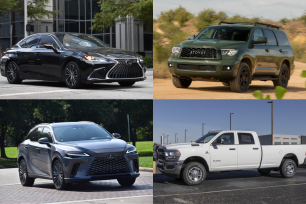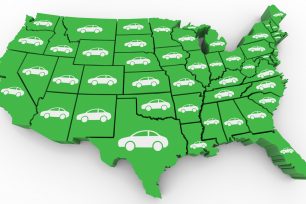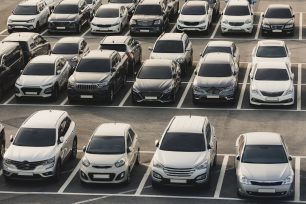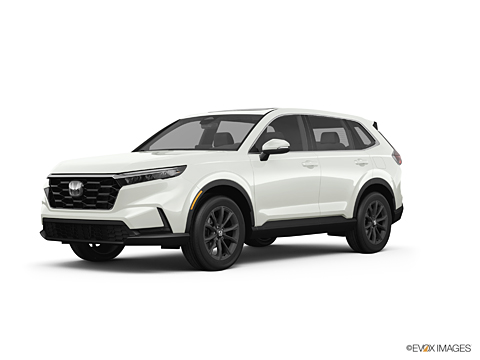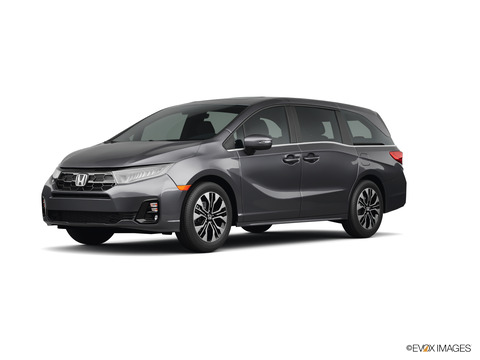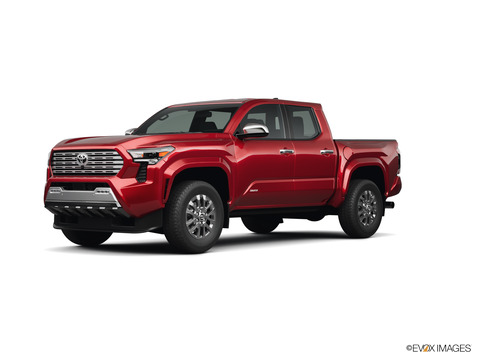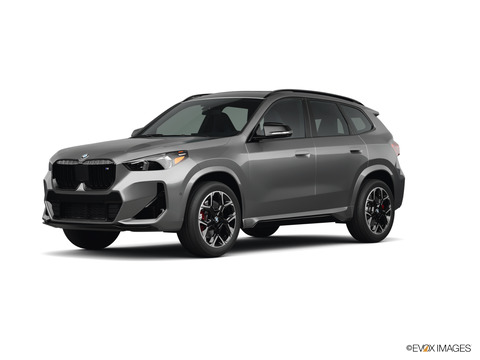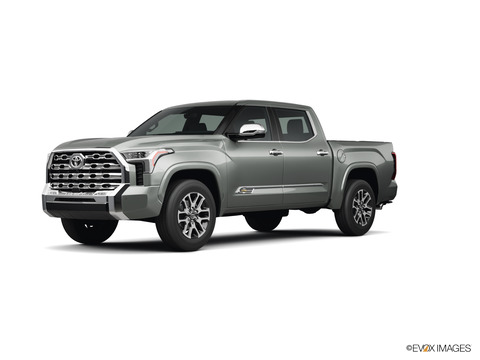

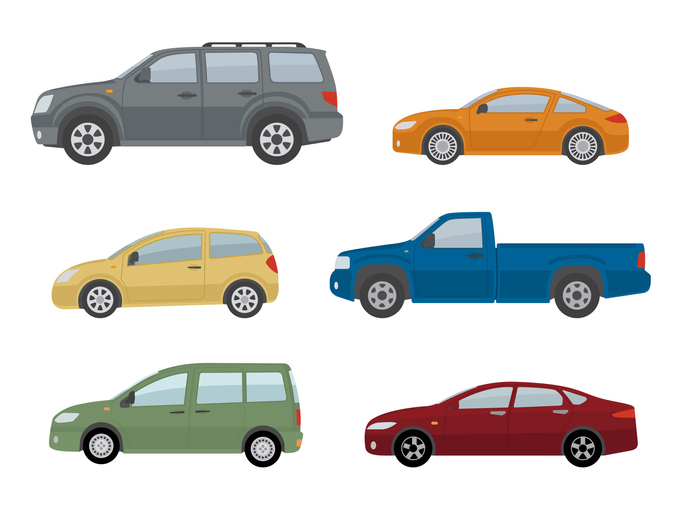
SUVs have steadily grown in popularity to become the nation’s most popular vehicle type. But how popular are SUVs compared to other vehicle categories across the country? Or do some states prefer pickup trucks or traditional passenger cars?
| Most Popular Vehicle Type By State - iSeeCars | |||||
| State | Dominant Vehicle Type | SUVs | Cars | Trucks | Minivans |
| Alabama | SUVs | 42.8% | 34.1% | 20.1% | 2.2% |
| Alaska | SUVs | 48.1% | 21.2% | 26.9% | 2.7% |
| Arizona | SUVs | 40.1% | 39.5% | 16.9% | 2.7% |
| Arkansas | SUVs | 43.3% | 29.6% | 24.3% | 2.2% |
| California | Cars | 38.7% | 46.4% | 11.3% | 2.6% |
| Colorado | SUVs | 50.5% | 27.7% | 18.7% | 2.0% |
| Connecticut | SUVs | 49.9% | 36.4% | 10.3% | 2.1% |
| Delaware | SUVs | 47.1% | 36.0% | 13.2% | 2.7% |
| Florida | SUVs | 43.0% | 39.3% | 13.8% | 2.7% |
| Georgia | SUVs | 42.9% | 37.9% | 15.7% | 2.5% |
| Hawaii | Cars | 38.5% | 41.6% | 13.7% | 5.3% |
| Idaho | SUVs | 41.2% | 26.3% | 29.3% | 2.5% |
| Illinois | SUVs | 49.0% | 33.6% | 12.4% | 3.9% |
| Indiana | SUVs | 46.2% | 33.1% | 15.8% | 4.0% |
| Iowa | SUVs | 46.4% | 25.3% | 23.4% | 4.1% |
| Kansas | SUVs | 44.4% | 31.1% | 20.2% | 3.5% |
| Kentucky | SUVs | 44.2% | 30.4% | 21.2% | 3.4% |
| Louisiana | SUVs | 41.8% | 32.1% | 23.7% | 1.8% |
| Maine | SUVs | 50.0% | 23.3% | 24.0% | 2.0% |
| Maryland | SUVs | 46.6% | 38.7% | 10.6% | 3.1% |
| Massachusetts | SUVs | 52.1% | 32.6% | 11.7% | 2.2% |
| Michigan | SUVs | 54.0% | 23.4% | 18.4% | 3.3% |
| Minnesota | SUVs | 50.9% | 24.3% | 20.2% | 3.8% |
| Mississippi | SUVs | 40.7% | 33.9% | 22.9% | 1.9% |
| Missouri | SUVs | 45.3% | 32.3% | 17.9% | 3.7% |
| Montana | SUVs | 45.4% | 17.2% | 34.7% | 2.0% |
| Nebraska | SUVs | 44.9% | 25.3% | 23.8% | 4.9% |
| Nevada | SUVs | 43.9% | 39.5% | 13.5% | 2.6% |
| New Hampshire | SUVs | 47.3% | 26.4% | 18.8% | 2.1% |
| New Jersey | SUVs | 51.1% | 36.8% | 7.9% | 2.6% |
| New Mexico | SUVs | 40.1% | 34.1% | 23.2% | 2.2% |
| New York | SUVs | 55.4% | 28.5% | 12.5% | 2.5% |
| North Carolina | SUVs | 44.3% | 35.9% | 15.8% | 2.8% |
| North Dakota | SUVs | 46.8% | 17.9% | 32.2% | 2.6% |
| Ohio | SUVs | 46.1% | 33.7% | 15.7% | 3.4% |
| Oklahoma | SUVs | 45.3% | 32.1% | 19.5% | 2.6% |
| Oregon | SUVs | 44.2% | 34.7% | 17.2% | 2.9% |
| Pennsylvania | SUVs | 50.5% | 31.2% | 14.7% | 2.6% |
| Rhode Island | SUVs | 52.0% | 32.0% | 12.8% | 2.0% |
| South Carolina | SUVs | 43.3% | 34.5% | 18.3% | 2.9% |
| South Dakota | SUVs | 45.5% | 22.2% | 28.8% | 2.9% |
| Tennessee | SUVs | 44.4% | 32.7% | 19.3% | 2.8% |
| Texas | SUVs | 42.3% | 34.4% | 20.4% | 2.0% |
| Utah | SUVs | 42.2% | 33.2% | 20.5% | 3.2% |
| Vermont | SUVs | 49.2% | 26.1% | 22.1% | 2.1% |
| Virginia | SUVs | 44.0% | 38.9% | 12.9% | 3.1% |
| Washington | SUVs | 42.3% | 36.8% | 17.1% | 2.8% |
| West Virginia | SUVs | 48.2% | 24.1% | 25.0% | 2.3% |
| Wisconsin | SUVs | 49.1% | 25.5% | 20.5% | 3.9% |
| Wyoming | SUVs | 43.6% | 17.0% | 37.1% | 1.7% |
- SUVs are the most popular vehicle type in 48 of 50 states, while cars account for the remaining two states.
- Pickup trucks are not the most popular vehicle type in any state and have the highest share in Wyoming at 37.1 percent.
- New York has the highest share of SUVs, which comprise 55.4 percent of the state’s vehicle share.
- Passenger cars are the most popular vehicle type in states with temperate climates
- California has the highest share of cars at 38.7 percent.
- Hawaii is the state that has the lowest share of SUVs, but the vehicle still accounts for more than one-third of the state’s vehicles.
- Hawaii has the highest share of minivans, at 5.3 percent.
iSeeCars.com analyzed over 21 million used car sales from April 2022 through March 2023. The shares of trucks, suvs, passenger cars (defined as sedans, coupes, convertibles, hatchbacks, and wagons), and minivans within each US state were calculated and used as ranking metrics across states.
About iSeeCars:
iSeeCars.com is a data-driven car search and research company that helps shoppers find the best car deals by providing key insights and valuable resources, including the iSeeCars VIN Check report and Best Cars Rankings. iSeeCars.com has saved users over $382 million so far by applying big data analytics powered by over 25 billion (and growing) data points and using proprietary algorithms to objectively analyze, score and rank millions of new cars and used cars.
iSeeCars helps millions of people make smarter car decisions and find the best deals by leveraging data-driven research and unbiased analysis. iSeeCars Research conducts independent studies that provide key insights on vehicles, market trends, and the automotive industry, including Best Cars Rankings and the annual Longest Lasting Cars Study. With the goal of making car shopping easier and more transparent, iSeeCars.com analyzes millions of car listings and offers valuable resources like iVIN Reports, Window Stickers, and Build Sheets. iSeeCars has saved users over $451 million using over 25 billion data points and proprietary algorithms to objectively analyze, score, and rank new and used vehicles.