
Highlights:
- Used EV prices rose 9.8% since last September, compared with 4.9% for hybrids, and just 0.3% for gas cars.
- Used EV prices now average $579 more than gas cars, compared with $2,227 less a year ago.
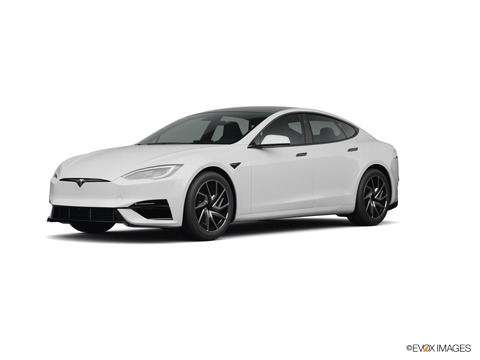
- Three Teslas rank in the top five for price increases across all used cars, including the Model S at 22.5%.
- Used EVs now sell nearly two weeks faster than gas cars.
- The Lexus IS 500 was the fastest-selling used car at 24.3 days, while the Ford Escape Plug-In Hybrid was the slowest at 154.5 days.
- The three slowest-selling used cars were hybrids, despite hybrids selling faster than gas cars overall.
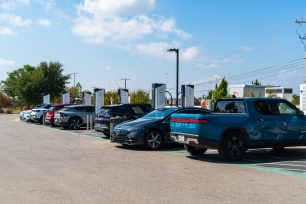
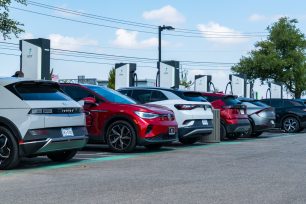
Used electric vehicles have experienced the biggest price increases and are now selling faster than both gasoline and hybrid cars, signaling a substantial shift across the used car market. Between September 2025 and September 2026, used EV prices increased 9.8% while the average time to sell a used EV dropped 10.1%. Gasoline vehicles experienced nearly flat prices and substantially longer selling times over the same period.
iSeeCars Research analyzed more than 1.5 million 1- to 5-year-old used vehicles to evaluate the EV market relative to hybrids and gasoline vehicles.
“The results reveal a market where EVs are appreciating in average asking price much faster than other drivetrains, while also spending less time waiting for buyers,” said iSeeCars Executive Analyst Karl Brauer. “Hybrids are experiencing moderate improvements in price and selling speed, while gasoline-powered vehicles have seen their selling times increase despite relatively stable prices.”
Used EV prices climb nearly 10% while gas car prices remain flat
Used electric vehicles averaged a price of $32,533 in September 2026, up $2,896 from $29,637 a year earlier. That 9.8% increase was twice the 4.9% gain for used hybrids and more than 30 times the percentage increase recorded for gasoline vehicles.Hybrid prices rose from $32,851 to $34,476, an increase of $1,625. Hybrids remained the most expensive drivetrain category, on average costing $1,943 more than EVs and $2,522 more than gasoline vehicles.
Gasoline-powered vehicles showed little movement, increasing just $90, from $31,864 to $31,954. Used EV prices now average $579 more than gas vehicles, compared with costing $2,227 less than gasoline models in September 2025.
| Used Car Price Comparison By Drivetrain: September 2026 - iSeeCars Study | |||
| Drivetrain | Year-over-Year Price Comparison | Average Price Sept. 2026 | Average Price Sept. 2025 |
| EVs | 9.8% | $32,533 | $29,637 |
| Hybrids | 4.9% | $34,476 | $32,851 |
| Gas Cars | 0.3% | $31,954 | $31,864 |
Used EVs sell 13 days faster than gasoline vehicles
Selling times reveal an even sharper contrast between electric and gasoline-powered vehicles.Used EVs averaged 41.9 days on the market in September 2026, down from 46.6 days a year earlier. That 4.7-day improvement represents a 10.1% reduction in selling time.
Gasoline vehicles moved in the opposite direction. Their average selling time increased from 45.7 to 54.8 days, a 19.9% increase. In September 2025, gas vehicles sold slightly faster than EVs. One year later, used EVs were selling 12.9 days faster than gasoline vehicles.
Hybrids landed between the two categories, averaging 48.6 days on the market, down modestly from 49.2 days a year earlier.
| Used Car Days on Market Comparison By Drivetrain: September 2026 - iSeeCars Study | |||
| Drivetrain | Year-over-Year Days on Market Comparison | Average Days on Market Sept. 2026 | Average Days on Market Sept. 2025 |
| EVs | -10.1% | 41.9 | 46.6 |
| Hybrids | -1.2% | 48.6 | 49.2 |
| Gas Cars | 19.9% | 54.8 | 45.7 |
Luxury cars lead the fastest sellers, while some hybrids take months to sell
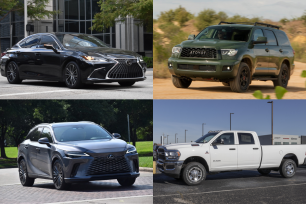
The fastest-selling used vehicles in Sept. 2026 included several luxury models, along with a mix of hybrids and electric vehicles. The Lexus IS 500 ranked first, averaging just 24.3 days on the market, less than half the 53.4-day average for all used vehicles. The Audi A4 Allroad ranked second, followed closely by the electric Audi Q4 Sportback e-tron.
Hybrids also performed well among the fastest-selling models. The Honda Civic Hybrid hatchback ranked fourth, followed by the fifth-ranked Lexus ES 300h and tenth-ranked Lexus RX 350h.
Three EVs made the top 10, including the Audi Q4 Sportback e-tron, Toyota bZ4X and Lexus RZ 300e. Each averaged fewer than 35 days on the market, compared with 41.9 days for used EVs overall.
| Top 10 Fastest-Selling Cars: September 2026 - iSeeCars Study | |||
| Rank | Model | Average Days on Market | Compared to Average for All Used Cars |
| 1 | Lexus IS 500 | 24.3 | 0.5x |
| 2 | Audi A4 Allroad | 29.5 | 0.6x |
| 3 | Audi Q4 Sportback e-tron | 29.8 | 0.6x |
| 4 | Honda Civic Hybrid (hatchback) | 30.9 | 0.6x |
| 5 | Lexus ES 300h | 33.1 | 0.6x |
| 6 | Kia Niro | 33.1 | 0.6x |
| 7 | Toyota bZ4X | 33.3 | 0.6x |
| 8 | Lexus LC 500 | 33.4 | 0.6x |
| 9 | Lexus RZ 300e | 34.3 | 0.6x |
| 10 | Lexus RX 350h | 34.7 | 0.6x |
| Average for All Used Cars | 53.4 | -- | |
| Top 10 Slowest-Selling Used Cars: September 2026 - iSeeCars Study | |||
| Rank | Model | Average Days on Market | Compared to Average for All Used Cars |
| 1 | Ford Escape Plug-In Hybrid | 154.5 | 2.9x |
| 2 | Lincoln Corsair (hybrid) | 142.4 | 2.7x |
| 3 | Mercedes-Benz S-Class (hybrid) | 129.4 | 2.4x |
| 4 | Cadillac Escalade iQ | 128.7 | 2.4x |
| 5 | Maserati Grecale | 108.3 | 2.0x |
| 6 | Acura MDX | 102.5 | 1.9x |
| 7 | Lexus LX 700h | 98.9 | 1.9x |
| 8 | Dodge Hornet | 96.7 | 1.8x |
| 9 | Hyundai Tucson Plug-In Hybrid | 94.0 | 1.8x |
| 10 | GMC Sierra EV | 93.2 | 1.7x |
| Average for All Used Cars | 53.4 | -- | |
The fastest- and slowest-selling EVs
Used EVs averaged 41.9 days on the market, which is 11.5 days less than the 53.4-day average for all used cars. Three of the 10 fastest-selling used EVs also ranked in the top 10 fastest-selling used cars, led by the Audi Q4 Sportback e-tron at 29.8 days.| Top 10 Fastest-Selling Used EVs: September 2026 - iSeeCars Study | |||
| Rank | Model | Average Days on Market | Compared to EV Average |
| 1 | Audi Q4 Sportback e-tron | 29.8 | 0.7x |
| 2 | Toyota bZ4X | 33.3 | 0.8x |
| 3 | Lexus RZ 300e | 34.3 | 0.8x |
| 4 | Honda Prologue | 35.0 | 0.8x |
| 5 | Polestar 2 | 35.5 | 0.8x |
| 6 | Audi Q4 e-tron | 35.8 | 0.9x |
| 7 | BMW iX | 36.2 | 0.9x |
| 8 | Kia EV6 | 36.7 | 0.9x |
| 9 | BMW i4 | 36.7 | 0.9x |
| 10 | Chevrolet Equinox EV | 36.7 | 0.9x |
| Average for Used EVs | 41.9 | -- | |
| Top 10 Slowest-Selling Used EVs: September 2026 - iSeeCars Study | |||
| Rank | Model | Average Days on Market | Compared to EV Average |
| 1 | Cadillac Escalade iQ | 128.7 | 3.1x |
| 2 | GMC Sierra EV | 93.2 | 2.2x |
| 3 | Chevrolet Silverado EV | 89.1 | 2.1x |
| 4 | Volvo EX90 | 80.2 | 1.9x |
| 5 | Dodge Charger | 80.1 | 1.9x |
| 6 | GMC Hummer EV (SUV) | 78.9 | 1.9x |
| 7 | Mercedes-Benz EQE (sedan) | 77.2 | 1.8x |
| 8 | GMC Hummer EV (truck) | 76.6 | 1.8x |
| 9 | Porsche Macan | 62.6 | 1.5x |
| 10 | Cadillac Optiq | 61.6 | 1.5x |
| Average for Used EVs | 41.9 | -- | |
Tesla models post some of the largest used car price increases
The BMW X2 led all models with a 24.3% annual price increase, followed by the Tesla Model S at 22.5% and Model X at 18.0%. The Tesla Model 3 ranked fifth at 15.4%. Two Lexus sedans ranked among the largest price gainers. The ES 300h hybrid increased 15.5%, while the gasoline-powered ES 350 rose 14.8%. These increases substantially exceeded the overall average used car price gain of just 0.9%.| Top 10 Used Cars With the Largest Price Increases: September 2026 - iSeeCars Study | ||||
| Rank | Model | Average Price Sep. 2026 | $ Difference Year-over-Year | % Difference Year-over-Year |
| 1 | BMW X2 | $33,425 | $6,524 | 24.3% |
| 2 | Tesla Model S | $57,862 | $10,636 | 22.5% |
| 3 | Tesla Model X | $61,309 | $9,336 | 18.0% |
| 4 | Lexus ES 300h | $42,836 | $5,745 | 15.5% |
| 5 | Tesla Model 3 | $28,931 | $3,870 | 15.4% |
| 6 | Lexus ES 350 | $41,251 | $5,333 | 14.8% |
| 7 | INFINITI QX80 | $48,135 | $5,953 | 14.1% |
| 8 | Nissan Murano | $27,574 | $3,017 | 12.3% |
| 9 | Honda Pilot | $36,449 | $3,935 | 12.1% |
| 10 | MINI Countryman | $29,234 | $3,009 | 11.5% |
| Average for All Used Cars | $32,096 | $275 | 0.9% | |
| Top 10 Used Cars With the Largest Price Drops: September 2026 - iSeeCars Study | ||||
| Rank | Model | Average Price Sep. 2026 | $ Difference Year-over-Year | % Difference Year-over-Year |
| 1 | Chrysler Voyager | $22,466 | -$4,713 | -17.3% |
| 2 | Lincoln Corsair (hybrid) | $37,259 | -$3,706 | -9.0% |
| 3 | Audi A6 | $32,122 | -$2,687 | -7.7% |
| 4 | Porsche 911 (convertible) | $126,195 | -$10,498 | -7.7% |
| 5 | Audi SQ8 | $67,361 | -$5,436 | -7.5% |
| 6 | Mercedes-Benz AMG GT | $74,967 | -$5,941 | -7.3% |
| 7 | BMW 2 Series | $27,664 | -$2,162 | -7.2% |
| 8 | Audi A5 Sportback | $31,340 | -$2,436 | -7.2% |
| 9 | Jeep Wrangler | $34,815 | -$2,642 | -7.1% |
| 10 | Chrysler Pacifica | $25,593 | -$1,853 | -6.8% |
| Average for All Used Cars | $32,096 | $275 | 0.9% | |
Used EV prices rebound after declining earlier in 2026
Used EV prices were falling year over year during the first three months of 2026, including a 3.4% decline in March. That trend reversed in April, when prices increased 2.7%, followed by progressively larger annual gains through August. September's 9.8% increase was slightly below August's 10.3%, but it marked the sixth consecutive month of positive year-over-year EV price growth.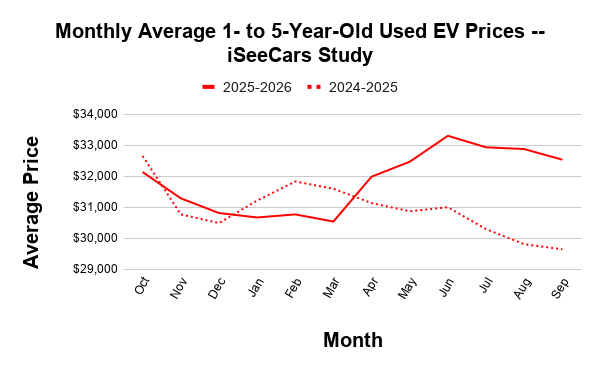
| Change in 1- to 5-Year-Old Used EV Prices - iSeeCars Study | |||
| Month | Average Price | $ Difference Year-over-Year | % Difference Year-over-Year |
| September 2026 | $32,533 | $2,896 | 9.8% |
| August 2026 | $32,876 | $3,073 | 10.3% |
| July 2026 | $32,933 | $2,645 | 8.7% |
| June 2026 | $33,305 | $2,308 | 7.4% |
| May 2026 | $32,467 | $1,602 | 5.2% |
| April 2026 | $31,984 | $852 | 2.7% |
| March 2026 | $30,535 | -$1,061 | -3.4% |
| February 2026 | $30,765 | -$1,063 | -3.3% |
| January 2026 | $30,666 | -$546 | -1.7% |
| December 2025 | $30,809 | $325 | 1.1% |
| November 2025 | $31,285 | $518 | 1.7% |
| October 2025 | $32,134 | -$517 | -1.6% |
| Change in 1- to 5-Year-Old Used Hybrid Prices - iSeeCars Study | |||
| Month | Average Price | $ Difference Year-over-Year | % Difference Year-over-Year |
| September 2026 | $34,476 | $1,625 | 4.9% |
| August 2026 | $34,683 | $1,493 | 4.5% |
| July 2026 | $34,941 | $1,175 | 3.5% |
| June 2026 | $34,816 | $758 | 2.2% |
| May 2026 | $34,274 | $153 | 0.4% |
| April 2026 | $33,750 | -$369 | -1.1% |
| March 2026 | $33,182 | -$468 | -1.4% |
| February 2026 | $33,082 | -$710 | -2.1% |
| January 2026 | $33,020 | -$5 | 0.0% |
| December 2025 | $28,502 | -$72 | -0.3% |
| November 2025 | $28,757 | -$157 | -0.5% |
| October 2025 | $29,454 | -$196 | -0.7% |
| Change in 1- to 5-Year-Old Used Gas Car Prices - iSeeCars Study | |||
| Month | Average Price | $ Difference Year-over-Year | % Difference Year-over-Year |
| September 2026 | $31,954 | $90 | 0.3% |
| August 2026 | $32,077 | $195 | 0.6% |
| July 2026 | $32,118 | -$190 | -0.6% |
| June 2026 | $32,245 | -$559 | -1.7% |
| May 2026 | $32,726 | -$71 | -0.2% |
| April 2026 | $31,971 | -$779 | -2.4% |
| March 2026 | $31,424 | -$686 | -2.1% |
| February 2026 | $30,695 | -$1,054 | -3.3% |
| January 2026 | $31,196 | -$1,021 | -3.2% |
| December 2025 | $30,395 | $523 | 1.8% |
| November 2025 | $30,586 | $426 | 1.4% |
| October 2025 | $31,146 | $3 | 0.0% |
Methodology
iSeeCars Research analyzed over 1.5 million 1- to 5-year-old used cars sold in September 2025 and September 2026. The average list prices and days-to-sell for each model were aggregated and compared across the two time periods. Heavy-duty vehicles, low-volume models, models no longer in production prior to the 2025 model year, and vehicles in production for fewer than four of the last five model years were excluded from further analysis.
About iSeeCars
iSeeCars helps millions of people make smarter car decisions and find the best deals by leveraging data-driven research and unbiased analysis. iSeeCars Research conducts independent studies that provide key insights on vehicles, market trends, and the automotive industry, including Best Cars Rankings and the annual Longest Lasting Cars Study. With the goal of making car shopping easier and more transparent, iSeeCars.com analyzes millions of car listings and offers valuable resources like iVIN Reports, Window Stickers, and Build Sheets. iSeeCars has saved users over $452 million using over 25 billion data points and proprietary algorithms to objectively analyze, score, and rank new and used vehicles.