
Used car prices rose sharply during the pandemic and remain substantially higher than they were in 2019, leaving today’s buyers with far less purchasing power across most vehicle segments.
iSeeCars analyzed the prices of more than 2 million 3-year-old used cars sold in 2019 and 2026 and found that their overall average price increased by 38.2%, a change of almost $10,000, from $23,624 to $32,651.
| Price Increases of 3-Year-Old Cars By Vehicle Segments: 2019 to 2026 – iSeeCars Study | |||
| Segment | Avg. Price 2019 | Avg. Price 2026 | % Change |
| Luxury Passenger Cars | $30,034 | $47,539 | 58.3% |
| Passenger Cars | $16,953 | $24,003 | 41.6% |
| Overall Average | $23,624 | $32,651 | 38.2% |
| Trucks | $29,724 | $40,335 | 35.7% |
| SUVs | $21,972 | $29,387 | 33.7% |
| Luxury SUVs | $34,836 | $44,382 | 27.4% |
Luxury passenger car prices increased the most
| 3-Year-Old Luxury Passenger Cars With the Largest Price Increases: 2019 to 2026 – iSeeCars Study | ||||
| Rank | Model | Avg. Price 2019 | Avg. Price 2026 | % Change |
| 1 | Porsche 911 (Convertible) | $109,574 | $198,090 | 80.8% |
| 2 | Porsche 911 (Coupe) | $142,197 | $256,070 | 80.1% |
| 3 | Acura TLX | $21,277 | $35,555 | 67.1% |
| 4 | BMW M3 | $49,356 | $80,420 | 62.9% |
| 5 | Mercedes-Benz E-Class (Coupe) | $31,630 | $51,399 | 62.5% |
| 6 | Mercedes-Benz E-Class (Convertible) | $39,864 | $64,456 | 61.7% |
| 7 | BMW 3 Series | $23,698 | $37,922 | 60.0% |
| Luxury Passenger Car Average | $30,034 | $47,539 | 58.3% | |
| 8 | Mercedes-Benz E-Class | $30,103 | $46,657 | 55.0% |
| 9 | Mercedes-Benz E-Class (Wagon) | $46,229 | $71,184 | 54.0% |
| 10 | BMW M4 | $50,214 | $76,121 | 51.6% |
| 11 | Volvo V60 Cross Country | $24,136 | $36,007 | 49.2% |
| 12 | BMW M5 | $59,765 | $87,164 | 45.8% |
| 13 | Porsche Panamera | $62,004 | $89,698 | 44.7% |
| 14 | BMW 2 Series | $26,945 | $38,657 | 43.5% |
| 15 | Lexus IS 350 | $30,265 | $42,754 | 41.3% |
| 16 | BMW 5 Series | $30,334 | $42,844 | 41.2% |
| 17 | Volvo S60 | $20,930 | $29,509 | 41.0% |
| 18 | Mercedes-Benz SL-Class | $64,762 | $90,987 | 40.5% |
| 19 | BMW 4 Series | $28,233 | $39,641 | 40.4% |
| 20 | Lexus ES 350 | $27,293 | $38,227 | 40.1% |
Some luxury SUVs had much larger price hikes than others
| 3-Year-Old Luxury SUVs With the Largest Price Increases: 2019 to 2026 – iSeeCars Study | ||||
| Rank | Model | Avg. Price 2019 | Avg. Price 2026 | % Change |
| 1 | Porsche Cayenne (Hybrid) | $50,301 | $88,387 | 75.7% |
| 2 | Mercedes-Benz G-Class | $99,967 | $172,781 | 72.8% |
| 3 | Lincoln Navigator L | $38,044 | $63,057 | 65.7% |
| 4 | Lincoln Navigator | $38,564 | $60,791 | 57.6% |
| 5 | Porsche Cayenne | $48,906 | $72,589 | 48.4% |
| 6 | Land Rover Range Rover | $65,403 | $95,836 | 46.5% |
| 7 | Lexus GX 460 | $39,085 | $56,992 | 45.8% |
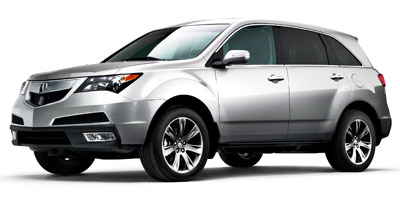
| 8 | Acura MDX | $29,222 | $40,912 | 40.0% |
| 9 | Mercedes-Benz GLE | $38,754 | $54,067 | 39.5% |
| 10 | Cadillac Escalade | $51,122 | $71,188 | 39.3% |
| 11 | Acura RDX | $26,055 | $36,015 | 38.2% |
| 12 | Cadillac Escalade ESV | $51,053 | $70,082 | 37.3% |
| 13 | BMW X4 | $31,680 | $43,055 | 35.9% |
| 14 | BMW X6 M | $60,284 | $80,522 | 33.6% |
| 15 | BMW X6 | $41,675 | $55,637 | 33.5% |
| 16 | Land Rover Range Rover Sport | $51,947 | $68,973 | 32.8% |
| 17 | Lexus RX 350 | $36,556 | $47,277 | 29.3% |
| 18 | Volvo XC60 | $26,378 | $34,098 | 29.3% |
| Luxury SUV Average | $34,836 | $44,382 | 27.4% | |
Prices for some of the least expensive cars increased over 50%
These cars were some of the lowest-cost 2019 models, generally priced around $10,000 to $12,000 for the Versa, Rio, Forte, and Elantra. By 2026, their average prices ranged from roughly $15,700 to $19,200. Though their dollar increases were smaller than those of six-figure luxury cars, the impact may be more consequential for shoppers limited by a fixed budget.
| 3-Year-Old Passenger Cars With the Largest Price Increases: 2019 to 2026 – iSeeCars Study | ||||
| Rank | Model | Avg. Price 2019 | Avg. Price 2026 | % Change |
| 1 | Hyundai Elantra | $12,295 | $19,178 | 56.0% |
| 2 | Nissan Versa | $10,146 | $15,718 | 54.9% |
| 3 | Chevrolet Camaro | $24,904 | $38,514 | 54.6% |
| 4 | Kia Rio | $10,217 | $15,727 | 53.9% |
| 5 | MINI Clubman | $18,876 | $28,945 | 53.3% |
| 6 | Kia Forte | $12,015 | $18,166 | 51.2% |
| 7 | Toyota Camry | $16,567 | $24,829 | 49.9% |
| 8 | Kia Rio 5-Door | $10,818 | $16,038 | 48.3% |
| 9 | Chrysler 300 | $20,338 | $29,839 | 46.7% |
| 10 | Nissan Sentra | $12,540 | $18,332 | 46.2% |
| 11 | Ford Mustang | $24,100 | $35,159 | 45.9% |
| 12 | MINI Hardtop 2 Door | $17,282 | $25,150 | 45.5% |
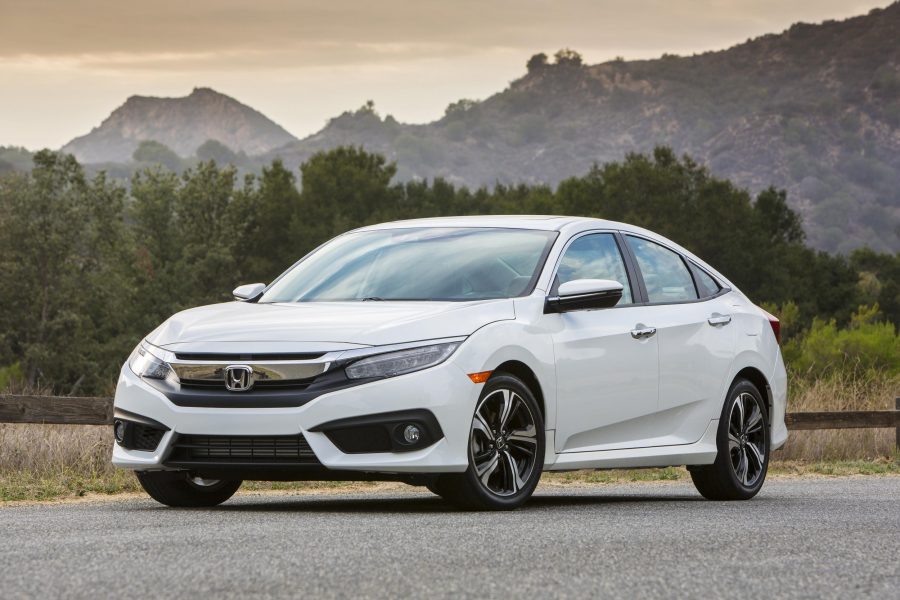
| 13 | Honda Civic | $16,430 | $23,771 | 44.7% |
| 14 | Chevrolet Corvette (convertible) | $56,610 | $81,902 | 44.7% |
| 15 | Hyundai Sonata | $14,781 | $21,310 | 44.2% |
| 16 | Volkswagen Golf GTI | $19,697 | $28,063 | 42.5% |
| 17 | Volkswagen Jetta | $13,446 | $19,123 | 42.2% |
| Passenger Car Average | $16,953 | $24,003 | 41.6% | |
Kia Sportage had the biggest drop in affordability among SUVs
| 3-Year-Old SUVs With the Largest Price Increases: 2019 to 2026 – iSeeCars Study | ||||
| Rank | Model | Avg. Price 2019 | Avg. Price 2026 | % Change |
| 1 | Kia Sportage | $16,312 | $24,543 | 50.5% |
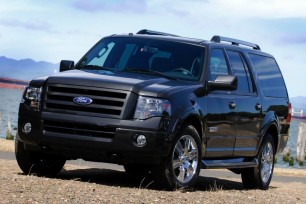
| 2 | Ford Expedition | $31,348 | $46,974 | 49.8% |
| 3 | Nissan Pathfinder | $21,533 | $31,677 | 47.1% |
| 4 | Kia Sorento | $19,305 | $27,903 | 44.5% |
| 5 | Jeep Compass | $15,515 | $22,196 | 43.1% |
| 6 | Mitsubishi Outlander | $16,520 | $23,591 | 42.8% |
| 7 | MINI Countryman | $20,104 | $28,509 | 41.8% |
| 8 | Volkswagen Tiguan | $16,325 | $23,146 | 41.8% |
| 9 | Honda CR-V | $20,677 | $29,245 | 41.4% |
| 10 | Toyota RAV4 | $20,825 | $29,190 | 40.2% |
| 11 | Toyota RAV4 Hybrid | $24,240 | $33,679 | 38.9% |
| 12 | Chevrolet Traverse | $22,672 | $31,331 | 38.2% |
| 13 | GMC Yukon | $42,817 | $58,580 | 36.8% |
| 14 | GMC Yukon XL | $43,518 | $59,032 | 35.7% |
| 15 | Honda Pilot | $27,892 | $37,695 | 35.1% |
| 16 | Subaru Forester | $20,643 | $27,776 | 34.6% |
| 17 | Toyota 4Runner | $32,141 | $43,172 | 34.3% |
| SUV Average | $21,972 | $29,387 | 33.7% | |
Nissan Frontier and GMC Canyon lead price increases for trucks
| 3-Year-Old Trucks With the Largest Price Increases: 2019 to 2026 – iSeeCars Study | ||||
| Rank | Model | Avg. Price 2019 | Avg. Price 2026 | % Change |
| 1 | Nissan Frontier | $20,317 | $31,292 | 54.0% |
| 2 | GMC Canyon | $26,574 | $38,855 | 46.2% |
| 3 | Ram 1500 | $28,105 | $40,060 | 42.5% |
| 4 | Ford F-150 | $31,497 | $43,121 | 36.9% |
| 5 | GMC Sierra 1500 | $33,542 | $45,785 | 36.5% |
| 6 | Toyota Tundra | $32,634 | $44,299 | 35.7% |
| Truck Average | $29,724 | $40,335 | 35.7% | |
| 7 | Chevrolet Silverado 1500 | $29,910 | $38,778 | 29.6% |
| 8 | Toyota Tacoma | $28,521 | $36,621 | 28.4% |
| 9 | Chevrolet Colorado | $25,639 | $32,009 | 24.8% |
| 10 | Nissan Titan XD | $33,234 | $40,036 | 20.5% |
Luxury brands lead, but mainstream brands are close behind
| Brands With the Largest 3-Year-Old Used Car Price Increases: 2019 to 2026 – iSeeCars Study | ||||
| Rank | Brand | Avg. Price 2019 | Avg. Price 2026 | % Change |
| 1 | Lincoln | $38,375 | $61,755 | 60.9% |
| 2 | Land Rover | $45,904 | $72,607 | 58.2% |
| 3 | Mercedes-Benz | $33,192 | $51,651 | 55.6% |
| 4 | Volkswagen | $15,140 | $22,677 | 49.8% |
| 5 | Toyota | $21,329 | $31,937 | 49.7% |
| 6 | Acura | $26,195 | $38,674 | 47.6% |
| 7 | Hyundai | $15,283 | $22,462 | 47.0% |
| 8 | Chrysler | $20,338 | $29,839 | 46.7% |
| 9 | Lexus | $31,960 | $46,811 | 46.5% |
| 10 | MINI | $18,893 | $27,257 | 44.3% |
| 11 | Ford | $25,211 | $36,294 | 44.0% |
| 12 | Ram | $28,105 | $40,060 | 42.5% |
| 13 | Honda | $19,907 | $28,061 | 41.0% |
| 14 | Mitsubishi | $15,950 | $22,388 | 40.4% |
| 15 | Jeep | $20,382 | $28,595 | 40.3% |
| 16 | GMC | $29,327 | $40,972 | 39.7% |
| 17 | Cadillac | $51,096 | $70,802 | 38.6% |
| Overall Average | $23,624 | $32,651 | 38.2% | |
The rise in late-model used car pricing, and related drop in affordability for mainstream consumers, can lead many buyers to consider older models with more miles. While older used cars may cost less at the time of purchase, consumers should budget for higher maintenance and repair costs after purchase. Consider purchasing a vehicle history report to check a car’s title history before buying.
Methodology
iSeeCars analyzed the prices of over 2 million 3-year-old used cars sold from January through June of 2019 and 2026. The difference in price was calculated for each model and brand, and compared with the appropriate segment’s average price difference.