Highlights:
- The national average is one EV charger for every 1,848 U.S. residents
- San Francisco is the most EV-friendly city in the U.S. and Milwaukee is the least EV friendly
- Vermont is the most EV-friendly state, while Mississippi is the least EV friendly
- The most improved city for EV friendliness is Hartford, CT, and the least improved is Oklahoma City
- The most improved state for EV friendliness is Connecticut, while the least improved is Alaska
Electric vehicle charging infrastructure remains a limiting factor in the transition from internal combustion engines to electrified vehicles. Range and charging anxiety are among the biggest challenges for existing EV owners, and may be the primary concern for potential EV buyers who are considering their first electric car.
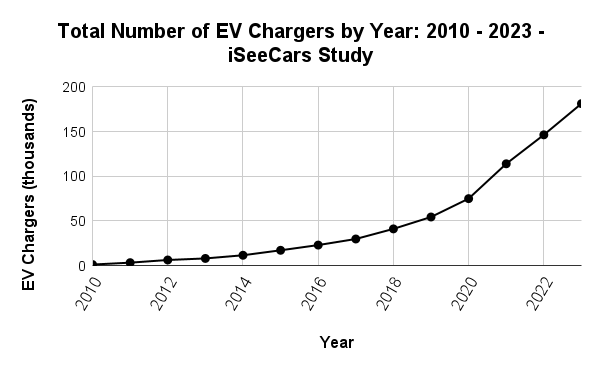
Thankfully, cities and states are trying to address this issue by investing in more chargers. America’s electric vehicle charging infrastructure grew by 23.9 percent over the past 12 months, with the total number of Level 2 (240V) and Level 3/Fast Chargers (480V+) rising from 146,337 to 181,270. The number of residents per charger improved by 18.9 percent, dropping from 2,277 residents for each charger a year ago to 1,848 residents per charger today.
| U.S. EV Charger Growth: 2022 - 2023 – iSeeCars Study | ||
| Year | Residents per Charger | Total Chargers |
| 2022 | 2,277 | 146,337 |
| 2023 | 1,848 | 181,270 |
| Year-over-Year Improvement | 18.9% | 23.9% |
Nationally, Level 2 chargers grew by 20.6 percent last year, while Level 3 chargers grew by almost twice as much, at 37.5 percent. “This growth in Level 3 chargers is encouraging because the increasing size of newer electric vehicle battery packs magnifies the need for more Fast Chargers to effectively serve the drivers of those vehicles,” said Karl Brauer, iSeeCars executive analyst.
| U.S. EV Charger Growth by Charger Type: 2022 - 2023 – iSeeCars Study | ||||
| Year | Level 2 Chargers | Level 3/DC Fast Chargers | ||
| Residents per Charger | Total Chargers | Residents per Charger | Total Chargers | |
| 2022 | 2,826 | 117,949 | 11,740 | 28,388 |
| 2023 | 2,355 | 142,241 | 8,581 | 39,029 |
| Year-over-Year Improvement | 16.7% | 20.6% | 26.9% | 37.5% |
Which cities have the most and least EV chargers?
When ranked by their total number of EV chargers, Los Angeles leads the way with over 21,000 chargers. San Francisco comes in second at nearly 16,000 chargers, followed by a big drop to New York City at 8,903 chargers and Boston at 6,516 chargers.The weakest EV charging network among the 50 largest metro areas belongs to Louisville with only 412 chargers, followed by Birmingham at 428 and Milwaukee at 455.
| Metro Areas With the Most and Fewest EV Chargers: 2023 – iSeeCars Study | ||||
| Rank | Most Chargers | Fewest Chargers | ||
| Metro Area | Total Chargers | Metro Area | Total Chargers | |
| 1 | Los Angeles, CA | 21,537 | Louisville, KY | 412 |
| 2 | San Francisco-Oakland-San Jose, CA | 15,874 | Birmingham, AL | 428 |
| 3 | New York, NY | 8,903 | Milwaukee, WI | 455 |
| 4 | Boston, MA-Manchester, NH | 6,516 | Greensboro-Winston Salem, NC | 509 |
| 5 | Washington, DC (Hagerstown, MD) | 6,234 | Norfolk-Portsmouth-Newport News,VA | 646 |
| 6 | Denver, CO | 5,094 | San Antonio, TX | 662 |
| 7 | Seattle-Tacoma, WA | 4,941 | Harrisburg-Lancaster-York, PA | 680 |
| 8 | San Diego, CA | 4,244 | Grand Rapids-Kalamazoo, MI | 681 |
| 9 | Sacramento-Stockton-Modesto, CA | 4,130 | Oklahoma City, OK | 682 |
| 10 | Atlanta, GA | 4,011 | Albuquerque-Santa Fe, NM | 701 |
What are the most and least EV-friendly cities?
“When ranked by the ratio of residents to EV chargers, California remains the best state for driving an electric vehicle, with five of the top 10 most EV-friendly cities located within its borders,” said Brauer. “Southeast and midwest cities, including Milwaukee, Birmingham, Cleveland, and Louisville, are among the least-friendly EV metro areas.”| Most and Least EV-Friendly Metro Areas: 2023 – iSeeCars Study | ||||||
| Rank | Most EV-Friendly | Least EV-Friendly | ||||
| Metro Area | Residents per Charger | Total Chargers | Metro Area | Residents per Charger | Total Chargers | |
| 1 | San Francisco-Oakland-San Jose, CA | 412 | 15,874 | Milwaukee, WI | 4,230 | 455 |
| 2 | San Diego, CA | 670 | 4,244 | Birmingham, AL | 3,936 | 428 |
| 3 | Los Angeles, CA | 724 | 21,537 | Cleveland-Akron (Canton), OH | 3,906 | 848 |
| 4 | Denver, CO | 804 | 5,094 | Louisville, KY | 3,807 | 412 |
| 5 | Boston, MA-Manchester, NH | 915 | 6,516 | San Antonio, TX | 3,775 | 662 |
| 6 | Sacramento-Stockton-Modesto, CA | 936 | 4,130 | St. Louis, MO | 3,750 | 730 |
| 7 | Kansas City, MO | 937 | 2,384 | Indianapolis, IN | 3,652 | 729 |
| 8 | Baltimore, MD | 953 | 2,742 | Greensboro-Winston Salem, NC | 3,157 | 509 |
| 9 | Fresno-Visalia, CA | 958 | 1,809 | Chicago, IL | 2,865 | 2,893 |
| 10 | Seattle-Tacoma, WA | 984 | 4,941 | Greenville-Spartanburg, SC | 2,792 | 753 |
| National | 1,848 | 181,270 | ||||
Which cities grew their EV infrastructure the most in 2023?
“It’s worth noting that several of the least-friendly EV cities saw some of the highest growth rates in EV infrastructure last year,” said Brauer. “Birmingham, Cleveland, San Antonio, St. Louis, and Indianapolis may rank poorly in the number of residents per EV charger, but they are also among the top 10 cities growing their charging infrastructure the fastest. At the same time, cities like San Francisco and Los Angeles rank well for residents per charger but were in the top 10 for least improved cities last year.”| Most and Least Improved Metro Areas for EV Infrastructure: 2022 - 2023 – iSeeCars Study | ||||||||
| Rank | Most Improved | Least Improved | ||||||
| Metro Area | % Improvement | Residents per Charger 2023 | Residents per Charger 2022 | Metro Area | % Improvement | Residents per Charger 2023 | Residents per Charger 2022 | |
| 1 | Hartford & New Haven, CT | 33.6% | 1,272 | 1,916 | Oklahoma City, OK | 9.8% | 2,491 | 2,763 |
| 2 | Indianapolis, IN | 32.8% | 3,652 | 5,433 | San Francisco-Oakland-San Jose, CA | 11.2% | 412 | 464 |
| 3 | Charlotte, NC | 32.7% | 2,055 | 3,055 | Grand Rapids-Kalamazoo, MI | 11.3% | 2,651 | 2,989 |
| 4 | St. Louis, MO | 31.9% | 3,750 | 5,508 | Kansas City, MO | 12.0% | 937 | 1,065 |
| 5 | San Antonio, TX | 31.6% | 3,775 | 5,517 | Fresno-Visalia, CA | 13.8% | 958 | 1,111 |
| 6 | Houston, TX | 31.5% | 2,717 | 3,967 | Miami-Ft. Lauderdale, FL | 14.4% | 1,303 | 1,522 |
| 7 | Birmingham, AL | 31.1% | 3,936 | 5,711 | Los Angeles, CA | 14.6% | 724 | 848 |
| 8 | Cleveland-Akron (Canton), OH | 29.8% | 3,906 | 5,567 | Salt Lake City, UT | 14.9% | 1,233 | 1,449 |
| 9 | Raleigh-Durham (Fayetteville), NC | 28.0% | 1,741 | 2,418 | Norfolk-Portsmouth-Newport News,VA | 15.5% | 2,639 | 3,122 |
| 10 | Pittsburgh, PA | 27.8% | 2,277 | 3,153 | West Palm Beach-Ft. Pierce, FL | 15.7% | 1,620 | 1,921 |
| National | 18.9% | 1,848 | 2,277 | |||||
Which states have the most and least EV chargers?
California easily ranks first in total EV infrastructure, with over 51,000 chargers. New York comes in a distant second with 11,951 chargers, followed by Florida with 9,776 and Texas with 9,060. Alaska has the fewest chargers, with 123, followed by North Dakota with 208, South Dakota with 237, and Wyoming with 253.| States With the Most and Fewest EV Chargers: 2023 – iSeeCars Study | ||||
| Rank | Most Chargers | Fewest Chargers | ||
| State | Total Chargers | State | Total Chargers | |
| 1 | California | 51,490 | Alaska | 123 |
| 2 | New York | 11,951 | North Dakota | 208 |
| 3 | Florida | 9,776 | South Dakota | 237 |
| 4 | Texas | 9,060 | Wyoming | 253 |
| 5 | Massachusetts | 7,223 | Montana | 352 |
| 6 | Washington | 6,008 | Mississippi | 419 |
| 7 | Colorado | 5,599 | West Virginia | 421 |
| 8 | Maryland | 5,207 | Idaho | 514 |
| 9 | Georgia | 5,085 | Delaware | 542 |
| 10 | Virginia | 4,550 | Nebraska | 572 |
What are the most and least EV-friendly states?
“California ranks well in total electric vehicle chargers, but it’s outranked by Vermont in residents per EV charger,” said Brauer. “Massachusetts, Colorado, and Maryland round out the top 5 states for electric vehicle chargers per resident, while Mississippi, Louisiana, Alaska, Kentucky, and Alabama are the least EV-friendly states.”| Most and Least EV-Friendly States: 2023 – iSeeCars Study | ||||||
| Rank | Most EV-Friendly | Least EV-Friendly | ||||
| State | Residents per Charger | Total Chargers | State | Residents per Charger | Total Chargers | |
| 1 | Vermont | 695 | 931 | Mississippi | 7,016 | 419 |
| 2 | California | 757 | 51,490 | Louisiana | 6,515 | 702 |
| 3 | Massachusetts | 969 | 7,223 | Alaska | 5,963 | 123 |
| 4 | Colorado | 1,050 | 5,599 | Kentucky | 5,520 | 820 |
| 5 | Maryland | 1,187 | 5,207 | Alabama | 4,674 | 1,093 |
| 6 | Oregon | 1,295 | 3,268 | Indiana | 4,404 | 1,558 |
| 7 | Washington | 1,300 | 6,008 | West Virginia | 4,204 | 421 |
| 8 | Maine | 1,313 | 1,063 | Wisconsin | 4,060 | 1,456 |
| 9 | Rhode Island | 1,427 | 768 | South Dakota | 3,879 | 237 |
| 10 | Connecticut | 1,475 | 2,452 | Idaho | 3,822 | 514 |
| National | 1,848 | 181,270 | ||||
Which states grew their EV infrastructure the most in 2023?
“Connecticut grew its EV infrastructure the fastest in 2023, with Louisiana, Delaware, Indiana, and North Carolina all improving their residents-per-charger ratio by at least 26 percent,” said Brauer. “Alaska put very little effort into EV infrastructure, growing its residents-per-charger metric by a paltry 1.6 percent. Hawaii, Vermont, Rhode Island, and Oklahoma had modest infrastructure improvement, with 10 percent or less improvement in residents per EV charger.”| Most and Least Improved States for EV Infrastructure: 2022 - 2023 – iSeeCars Study | ||||||||
| Rank | Most Improved | Least Improved | ||||||
| State | % Improvement | Residents per Charger 2023 | Residents per Charger 2022 | State | % Improvement | Residents per Charger 2023 | Residents per Charger 2022 | |
| 1 | Connecticut | 33.6% | 1,475 | 2,221 | Alaska | 1.6% | 5,963 | 6,060 |
| 2 | Louisiana | 31.1% | 6,515 | 9,460 | Hawaii | 7.7% | 1,595 | 1,728 |
| 3 | Delaware | 28.3% | 1,904 | 2,655 | Vermont | 9.4% | 695 | 768 |
| 4 | Indiana | 28.1% | 4,404 | 6,128 | Rhode Island | 9.7% | 1,427 | 1,581 |
| 5 | North Carolina | 26.8% | 2,490 | 3,403 | Oklahoma | 10.7% | 2,900 | 3,247 |
| 6 | Arkansas | 26.3% | 3,692 | 5,011 | Utah | 14.2% | 1,499 | 1,747 |
| 7 | Ohio | 25.9% | 3,175 | 4,282 | Kansas | 14.2% | 2,368 | 2,760 |
| 8 | Montana | 25.8% | 3,218 | 4,335 | California | 14.2% | 757 | 882 |
| 9 | New Mexico | 25.7% | 2,974 | 4,003 | West Virginia | 15.4% | 4,204 | 4,969 |
| 10 | New Jersey | 25.7% | 2,522 | 3,393 | New York | 16.9% | 1,638 | 1,971 |
| National | 18.9% | 1,848 | 2,277 | |||||
Methodology
iSeeCars analyzed data from the U.S. Department of Energy’s Alternative Fuels Data Center through 2023 as of February 18, 2024. The number of Level 2 EVSE and Level 3/DC Fast EVSE ports was aggregated nationally, by metro area, and by state. The number of chargers was normalized by population counts from the U.S. Census Bureau and expressed as the number of residents per charger. For metro areas, the latest population data available from 2022 was used for both 2022 and 2023 charger counts; for state and national data, population data for 2022 and 2023 were used for their respective charger counts.
About iSeeCars.com