Highlights:
- The average price of 3-year-old used cars has increased 40.9% since the pandemic, from $23,159 in 2019 to $32,635 in 2025
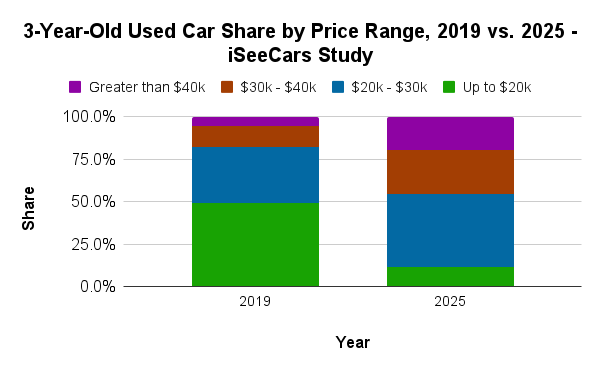
- Used cars priced under $20,000 made up 49.3% of the 3-year-old market in 2019, compared to 11.5% of the market today
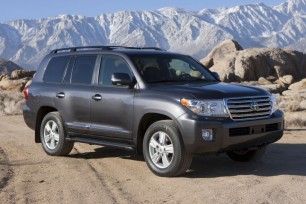
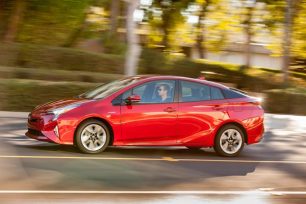
- Passenger cars saw the biggest price increase since 2019, up 48.7%, with truck prices up 28.8% and SUVs up 15.4%
- In 2019, 42.9% of 3-year-old Honda CR-Vs and 44.3% of Toyota RAV4s cost less than $20,000; in 2025 those numbers have dropped to almost zero
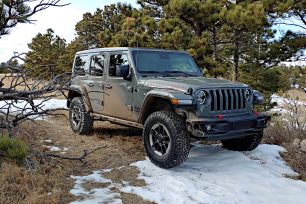
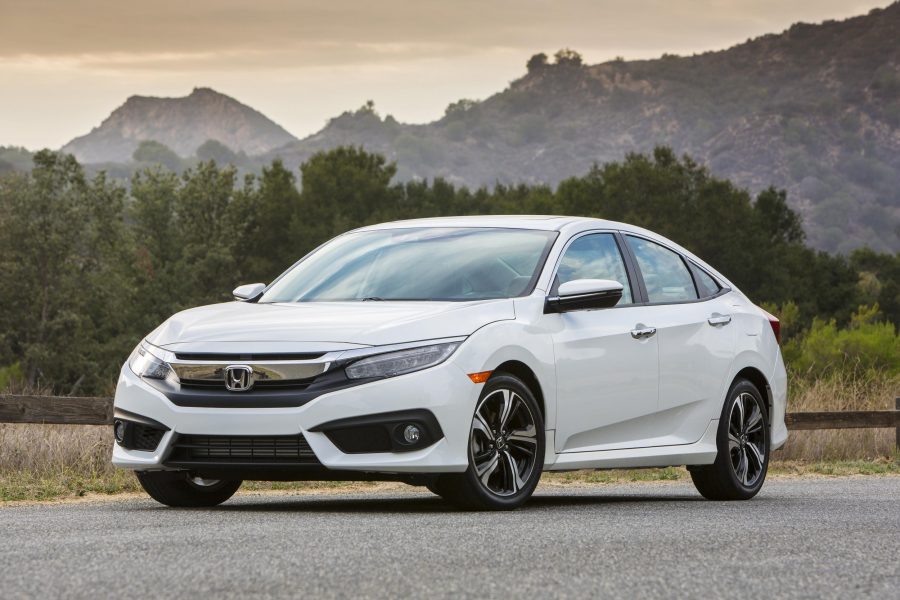
- Best-selling 3-year-old used models that are no longer available for under $20,000 include the Chevrolet Equinox, Honda Civic, Kia Sportage, Nissan Rogue, Toyota Camry, and Toyota Corolla
Restricted new-car production during the pandemic from 2020 to 2022, has led to restricted used car supply and substantially higher used car prices today. Consumers have to pay about $9,500 more for a 3-year-old used car in 2025 compared to pre-pandemic pricing. With used car prices rising for the last three months, there’s no indication prices will drop anytime soon.
iSeeCars analyzed over 2.6 million 3-year-old used cars and found the average used car now costs $32,635. That is a $9,476 price increase over the last six years compared to the average price of $23,159 in 2019.
“The pandemic may be a fading memory, but the lack of new car production five years ago has created a ‘pandemic hangover’ effect for today’s used car market,” said iSeeCars Executive Analyst Karl Brauer. “Many car buyers are now priced out of late-model used cars, forcing them to consider older models with more miles to fit within their budget.”
Newer Used Cars Cost Too Much for Many Buyers
In 2019 the sub-$20,000 price range made up the largest percentage (49.3%) of 3-year-old used cars. But in 2025 the higher $20,000 to $30,000 price range now makes up the largest percentage (43%) of 3-year-old used cars.“This shift in pricing has dramatically reduced access to late-model used cars for buyers with a $20,000 budget. While these buyers had access to half of the 3-year-old used cars for sale in 2019, that same $20,000 will only buy them 11.5% of 3-year-old used cars today,” said Brauer.
| Three-Year-Old Used Cars by Price Range: 2019 vs. 2025 - iSeeCars Study | |||
| Price Range | Share 2019 | Share 2025 | % Change in Share |
| Up to $20k | 49.3% | 11.5% | -76.6% |
| $20k - $30k | 32.7% | 43.0% | 31.5% |
| $30k - $40k | 12.4% | 26.1% | 110.3% |
| Greater than $40k | 5.6% | 19.4% | 245.7% |
Passenger Cars Suffer Biggest Decline in Affordability
Top-selling passenger cars like the Honda Civic, Toyota Camry, and Toyota Corolla made up the bulk of affordable used cars in 2019. Back then, 70.7% of passenger cars were priced below $20,000. Today, only 28.1% of 3-year-old passenger cars are priced below $20,000, which is a 60.2% decline. SUVs also left the sub-$20,000 price range, with their share down 79.3%.

| Three-Year-Old Used Passenger Cars and SUVs by Price Range: 2019 vs. 2025 - iSeeCars Study | ||||||
| Price Range | Passenger Cars | SUVs | ||||
| Share 2019 | Share 2025 | % Change in Share | Share 2019 | Share 2025 | % Change in Share | |
| Up to $20k | 70.7% | 28.1% | -60.2% | 39.2% | 8.1% | -79.3% |
| $20k - $30k | 20.6% | 49.5% | 140.4% | 40.4% | 48.4% | 19.7% |
| $30k - $40k | 5.1% | 11.2% | 120.1% | 13.9% | 27.4% | 96.8% |
| Greater than $40k | 3.7% | 11.2% | 204.7% | 6.4% | 16.1% | 150.3% |
Passenger Cars Experience Biggest Price Hike
Affordability has suffered across every vehicle type, but with a 48.7% average price hike, cars saw the biggest increase between 2019 and 2025.| Average Price of 3-Year-Old Cars by Vehicle Type: 2019 vs. 2025 - iSeeCars Study | |||
| Vehicle Type | Average Price 2019 | Average Price 2025 | % Change |
| Passenger Cars | $19,734 | $29,343 | 48.7% |
| SUVs | $31,649 | $36,509 | 15.4% |
| Trucks | $31,627 | $40,731 | 28.8% |
| All Cars | $23,159 | $32,635 | 40.9% |
Popular and (Formerly) Affordable Used Models Now Priced Above $20,000
Many of the best-selling used models were widely available for $20,000 or less in 2019, but not in 2025. Examples include the Honda Civic, Honda CR-V, Toyota RAV4, Subaru Forester, and Subaru Crosstrek. All of these models are now largely priced above $20,000.| Best-Selling 3-Year-Old Used Cars Under $20,000: 2019 vs. 2025 - iSeeCars Study | |||
| Model | Share of Used Cars Under < $20k, 2019 | Share of Used Cars Under < $20k, 2025 | % Change in Share |
| Honda CR-V | 42.9% | 0.2% | -99.6% |
| Toyota RAV4 | 44.3% | 0.5% | -98.9% |
| Chevrolet Silverado 1500 | 1.5% | 0.0% | -98.8% |
| Subaru Forester | 41.4% | 0.9% | -97.8% |
| GMC Sierra 1500 | 1.4% | 0.0% | -97.7% |
| Subaru Crosstrek | 33.8% | 1.7% | -95.1% |
| Honda Civic | 97.6% | 5.7% | -94.1% |
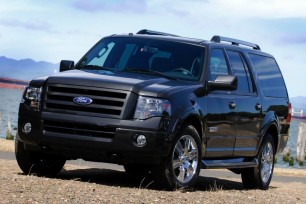
| Ford Explorer | 6.1% | 0.4% | -93.5% |
| Subaru Outback | 17.0% | 1.1% | -93.3% |
| Ford F-150 | 2.2% | 0.2% | -92.6% |
| Toyota Camry | 96.7% | 8.3% | -91.4% |
| Toyota Tacoma | 2.2% | 0.3% | -88.1% |
| Nissan Rogue | 84.5% | 12.4% | -85.3% |
| Honda HR-V | 85.6% | 17.1% | -80.1% |
| Chevrolet Equinox | 88.1% | 22.3% | -74.7% |
| Jeep Grand Cherokee | 0.1% | 0.0% | -70.0% |
| Kia Sportage | 93.1% | 46.5% | -50.1% |
| Toyota Corolla | 99.9% | 62.9% | -37.0% |
| Nissan Sentra | 100.0% | 85.0% | -15.0% |
| Chevrolet Trax | 99.5% | 87.7% | -11.9% |
| All Cars | 49.3% | 11.5% | -76.6% |
| Average Price of 3-Year-Old Best-Selling Cars: 2019 vs. 2025 - iSeeCars Study | |||
| Model | Average Price 2019 | Average Price 2025 | % Change |
| Nissan Sentra | $12,504 | $18,224 | 45.7% |
| Honda Civic | $16,472 | $23,813 | 44.6% |
| Toyota Camry | $16,556 | $23,755 | 43.5% |
| Toyota Corolla | $14,369 | $19,792 | 37.7% |
| GMC Sierra 1500 | $33,567 | $46,132 | 37.4% |
| Toyota RAV4 | $20,801 | $28,431 | 36.7% |
| Honda CR-V | $20,770 | $28,318 | 36.3% |
| Ford F-150 | $31,489 | $42,663 | 35.5% |
| Subaru Forester | $20,669 | $27,859 | 34.8% |
| Nissan Rogue | $17,792 | $23,971 | 34.7% |
| Chevrolet Silverado 1500 | $29,957 | $40,253 | 34.4% |
| Chevrolet Equinox | $17,440 | $22,228 | 27.5% |
| Kia Sportage | $16,348 | $20,584 | 25.9% |
| Jeep Grand Cherokee | $28,174 | $34,962 | 24.1% |
| Chevrolet Trax | $14,943 | $18,459 | 23.5% |
| Ford Explorer | $26,576 | $32,712 | 23.1% |
| Subaru Crosstrek | $20,923 | $25,527 | 22.0% |
| Subaru Outback | $22,818 | $27,771 | 21.7% |
| Toyota Tacoma | $28,511 | $34,646 | 21.5% |
| Honda HR-V | $18,165 | $22,023 | 21.2% |
| All Cars | $23,159 | $32,635 | 40.9% |
Changes in Affordable Cars by Metro Area
In each of the nation’s 50 largest metro areas by population, there was a substantial drop in the share of lower-priced cars. The Boston-Manchester area had the largest drop, while the Miami-Fort Lauderdale had the smallest.| Loss of Used Car Share Under $20,000 in Top 50 Metro Areas: 2019 vs. 2025 – iSeeCars Study | ||||
| Rank | Metro Area | Share of Used Car Sales < $20k, 2019 | Share of Used Car Sales < $20k, 2025 | % Change in Share |
| 1 | Boston, MA-Manchester, NH | 45.1% | 6.5% | -85.7% |
| 2 | Minneapolis-St. Paul, MN | 44.6% | 6.7% | -84.9% |
| 3 | Hartford & New Haven, CT | 52.1% | 8.9% | -82.9% |
| 4 | Austin, TX | 48.7% | 8.5% | -82.5% |
| 5 | Philadelphia, PA | 49.4% | 9.0% | -81.7% |
| 6 | Grand Rapids-Kalamazoo, MI | 49.5% | 9.2% | -81.5% |
| 7 | Greenville-Spartanburg, SC | 47.5% | 8.9% | -81.4% |
| 8 | Indianapolis, IN | 51.8% | 9.7% | -81.3% |
| 9 | Harrisburg-Lancaster-York, PA | 48.0% | 9.2% | -80.9% |
| 10 | Pittsburgh, PA | 49.2% | 9.5% | -80.6% |
| 11 | Denver, CO | 41.8% | 8.4% | -79.9% |
| 12 | Columbus, OH | 55.6% | 11.2% | -79.9% |
| 13 | Milwaukee, WI | 49.1% | 10.4% | -78.8% |
| 14 | Kansas City, MO | 51.9% | 11.1% | -78.7% |
| 15 | Cincinnati, OH | 54.5% | 11.6% | -78.7% |
| 16 | Nashville, TN | 47.2% | 10.2% | -78.4% |
| 17 | Albuquerque-Santa Fe, NM | 47.3% | 10.3% | -78.2% |
| 18 | Seattle-Tacoma, WA | 43.6% | 9.6% | -77.9% |
| 19 | Louisville, KY | 52.5% | 11.6% | -77.9% |
| 20 | Salt Lake City, UT | 52.3% | 11.7% | -77.5% |
| 21 | Raleigh-Durham (Fayetteville), NC | 52.3% | 11.8% | -77.5% |
| 22 | Chicago, IL | 51.5% | 11.6% | -77.4% |
| 23 | Portland, OR | 45.5% | 10.3% | -77.4% |
| 24 | Cleveland-Akron (Canton), OH | 58.6% | 13.3% | -77.4% |
| 25 | Atlanta, GA | 49.4% | 11.2% | -77.3% |
| 26 | Sacramento-Stockton-Modesto, CA | 51.1% | 11.6% | -77.2% |
| 27 | Dallas-Ft. Worth, TX | 46.1% | 10.7% | -76.7% |
| 28 | St. Louis, MO | 47.9% | 11.5% | -76.0% |
| 29 | Baltimore, MD | 51.3% | 12.3% | -76.0% |
| 30 | Los Angeles, CA | 52.8% | 12.8% | -75.8% |
| 31 | Charlotte, NC | 51.9% | 12.6% | -75.7% |
| 32 | Washington, DC (Hagerstown, MD) | 50.3% | 12.2% | -75.7% |
| 33 | San Antonio, TX | 48.0% | 11.7% | -75.5% |
| 34 | Birmingham, AL | 46.0% | 11.4% | -75.1% |
| 35 | New York, NY | 45.7% | 11.7% | -74.5% |
| 36 | Greensboro-Winston Salem, NC | 54.6% | 14.1% | -74.1% |
| 37 | Detroit, MI | 52.2% | 13.6% | -73.9% |
| 38 | San Diego, CA | 52.9% | 13.9% | -73.8% |
| 39 | Phoenix, AZ | 54.2% | 14.2% | -73.8% |
| 40 | Norfolk-Portsmouth-Newport News,VA | 57.1% | 15.2% | -73.4% |
| 41 | San Francisco-Oakland-San Jose, CA | 45.3% | 12.8% | -71.7% |
| 42 | Jacksonville, FL | 51.9% | 14.8% | -71.6% |
| 43 | Fresno-Visalia, CA | 57.1% | 16.7% | -70.8% |
| 44 | Houston, TX | 45.8% | 13.4% | -70.7% |
| 45 | Oklahoma City, OK | 46.7% | 13.7% | -70.7% |
| 46 | Tampa-St Petersburg (Sarasota), FL | 54.3% | 16.0% | -70.5% |
| 47 | West Palm Beach-Ft. Pierce, FL | 52.7% | 15.7% | -70.2% |
| 48 | Las Vegas, NV | 53.8% | 16.5% | -69.4% |
| 49 | Orlando-Daytona Beach, FL | 54.6% | 18.4% | -66.3% |
| 50 | Miami-Ft. Lauderdale, FL | 54.6% | 20.8% | -61.9% |
Methodology
iSeeCars analyzed over 2.6 million 3-year-old used cars sold between January and June of 2019 and 2025. List prices were tallied and aggregated to compare the share of cars at various price points across the two periods. A selection of best-selling vehicles were additionally analyzed and ranked.
About iSeeCars.com