Highlights:
- Used hybrid market share grew 2.6 times faster than used EV share
- Used hybrid prices decreased 1.4% year-over-year in Q1 2026 compared to a 2.8% drop in gasoline vehicle prices and a 3.0% drop in EV prices
- Used Tesla prices were resilient, holding steady at just 0.1% lower, while non-Tesla EV prices dropped 10.3% in the same period
- While all used vehicles are selling slower compared to a year ago, non-Tesla EVs are the slowest at 60.1 days and Tesla EVs are selling the fastest at 32.4 days
- Teslas and hybrids were also prominent among the fastest-selling models last month, accounting for 10 of the top 20 rankings
While the broader used car landscape cools off with lower prices and cars sitting on dealer lots 45.5% longer than a year ago, consumer demand is sharply focused on hybrids and Teslas over electric vehicles from legacy automakers.
The latest iSeeCars study analyzed over 6.7 million 1- to 5-year-old used cars sold in Q1 2025 and Q1 2026 to determine shifts in market share; average listing prices; and days on market for gasoline, hybrid, and electric vehicles.
“Many people assumed the recent spike in gas prices would mean a resurgence in EV demand, but hybrids have proven to be the real benefactor of rising fuel costs,” said iSeeCars Executive Analyst Karl Brauer. “Hybrids are selling faster, retaining more value, and growing their market share faster than electric vehicles, though Tesla’s EVs are also doing quite well.”
EV vs. Hybrid Market Share: Hybrids Are Winning
Hybrids are steadily gaining share in the used car market and taking market share from traditional gas vehicles as consumers look for a practical, range-anxiety-free alternative to fully electric cars.In the first quarter of 2026, the market share for 1- to 5-year-old hybrid vehicles increased by 41.8% compared to the same period in 2025. During the same timeframe, traditional gas vehicles saw a 2.9% decline in market share and EVs saw 15.9% growth. The data suggests buyers are increasingly willing to try alternative drivetrains, but they are heavily favoring the intermediate step of hybrid technology over the full commitment required by an electric vehicle.
| Share of 1- to 5-Year-Old Used Cars By Drivetrain: Q1 2025 vs. 2026 - iSeeCars Study | |||||
| Period | Gas Car Share | EV Share | Non-Tesla EV Share | Tesla EV Share | Hybrid Share |
| Q1 2025 | 91.8% | 3.2% | 1.8% | 1.3% | 5.1% |
| Q1 2026 | 89.1% | 3.7% | 2.4% | 1.3% | 7.2% |
| Year-over-Year % Change | -2.9% | 15.9% | 30.1% | -3.9% | 41.8% |
Price Trend Divergence: Hybrids and Teslas Are Winning
The used electric vehicle market is experiencing a profound price correction, but the data reveals a stark division between manufacturers.While the average price of a 1- to 5-year-old non-Tesla EV fell 10.3% in Q1 2026 year-over-year, the average price of a used Tesla was essentially flat at 0.1% lower across the same periods. Traditional gas car prices dropped 2.8% during this same period, while hybrid prices dropped by half that amount, at just -1.4%. This suggests that, while legacy automakers are struggling to maintain residual values for their battery-powered models, Tesla and hybrid vehicles have managed to stabilize their pricing power in a turbulent market.
| Average Price of 1- to 5-Year-Old Used Cars By Drivetrain: Q1 2025 vs. 2026 - iSeeCars Study | |||||
| Period | Gas Cars | All EVs | Non-Tesla EVs | Tesla EVs | Hybrids |
| Q1 2025 | $32,008 | $31,600 | $31,928 | $31,476 | $33,564 |
| Q1 2026 | $31,110 | $30,647 | $28,649 | $31,458 | $33,097 |
| Year-over-Year % Change | -2.8% | -3.0% | -10.3% | -0.1% | -1.4% |
The Great Used Car Sales Slowdown: Except for Teslas
Used cars are taking longer to sell, regardless of drivetrain, but Tesla vehicles remain the fastest-selling EVs with just a tiny 3.8% slowdown in sales rate. That equates to about one extra day (32.4 days in Q1 2026 versus 31.2 days in Q1 2025). This compares to an average of 54.1 days for gasoline cars, 54.4 days for hybrids, and 60.1 days for non-Tesla electric vehicles.| Average Days on Market of 1- to 5-Year-Old Used Cars By Drivetrain: Q1 2025 vs. 2026 - iSeeCars Study | |||||
| Period | Gas Cars | EVs | Non-Tesla EVs | Tesla EVs | Hybrids |
| Q1 2025 | 40.5 | 41.5 | 50.1 | 31.2 | 40.1 |
| Q1 2026 | 54.1 | 49.9 | 60.1 | 32.4 | 54.4 |
| Year-over-Year % Change | 33.6% | 20.2% | 20.0% | 3.8% | 35.7% |
20 Used Cars With the Largest Price Drops
Looking at model-level shifts over the past year supports earlier trends showing hybrids and Teslas outperforming the overall market and non-Tesla EVs. The Volkswagen ID.4’s price has fallen the most over the past year, dropping 13.2% ($3,300).Other electric vehicles seeing big price drops in the past 12 months include the Ford Mustang Mach-E, Nissan LEAF, and Hyundai Kona Electric. Multiple Audis and the Genesis GV80 are also among the top 10 vehicles for lost value, but all-new versions of these models have been introduced in the past year, which typically increases depreciation for used versions of the same car.
| 1- to 5-Year-Old Used Cars With the Largest Year-over-Year Price Drops, March 2026 - iSeeCars Study | ||||
| Rank | Model | Average Price, March 2026 | $ Year-over-Year Change | % Year-over-Year Change |
| 1 | Volkswagen ID.4 | $21,623 | -$3,300 | -13.2% |
| 2 | Audi A5 Sportback | $32,742 | -$3,788 | -10.4% |
| 3 | Genesis GV80 | $42,959 | -$4,848 | -10.1% |
| 4 | Audi Q5 (Hybrid) | $35,942 | -$3,978 | -10.0% |
| 5 | Lincoln Corsair (Hybrid) | $39,586 | -$4,293 | -9.8% |
| 6 | Ford Mustang Mach-E | $29,373 | -$3,076 | -9.5% |
| 7 | Nissan LEAF | $15,408 | -$1,512 | -8.9% |
| 8 | Audi SQ5 Sportback | $42,380 | -$4,125 | -8.9% |
| 9 | Kia Niro EV | $19,670 | -$1,879 | -8.7% |
| 10 | Audi Q5 Sportback | $35,840 | -$3,348 | -8.5% |
| 11 | Hyundai Kona Electric | $18,933 | -$1,745 | -8.4% |
| 12 | Volvo S60 | $26,338 | -$2,217 | -7.8% |
| 13 | Genesis G80 | $37,100 | -$3,031 | -7.6% |
| 14 | Jeep Grand Cherokee L | $31,650 | -$2,238 | -6.6% |
| 15 | Audi SQ8 | $69,659 | -$4,784 | -6.4% |
| 16 | Ford Bronco | $44,067 | -$3,014 | -6.4% |
| 17 | Porsche 718 Cayman | $122,631 | -$7,794 | -6.0% |
| 18 | GMC Terrain | $23,102 | -$1,461 | -5.9% |
| 19 | Buick Encore GX | $20,616 | -$1,295 | -5.9% |
| 20 | Ford Explorer Hybrid | $29,405 | -$1,823 | -5.8% |
| Overall Average | $31,486 | -$667 | -2.1% | |
20 Used Cars With the Largest Price Increase
These 20 cars are bucking the trend of falling used car prices, with price jumps between 7.5% and 23.5%. The BMW X2 ranks first, gaining $6,609 in value over the past year. The MINI Countryman, Ford Mustang, Lincoln Aviator, and Acura TLX also saw impressive price bumps between $3,000 and $4,250.| 1- to 5-Year-Old Used Cars With the Largest Year-over-Year Price Increases, March 2026 - iSeeCars Study | ||||
| Rank | Model | Average Price, March 2026 | $ Year-over-Year Change | % Year-over-Year Change |
| 1 | BMW X2 | $34,784 | $6,609 | 23.5% |
| 2 | MINI Countryman | $29,753 | $3,694 | 14.2% |
| 3 | Ford Mustang | $29,602 | $2,794 | 10.4% |
| 4 | Lincoln Aviator | $47,168 | $4,250 | 9.9% |
| 5 | Acura TLX | $34,473 | $3,034 | 9.7% |
| 6 | Tesla Model S | $52,398 | $4,467 | 9.3% |
| 7 | Nissan Murano | $26,990 | $2,277 | 9.2% |
| 8 | Chrysler Voyager | $24,082 | $2,005 | 9.1% |
| 9 | BMW 3 Series | $37,205 | $3,082 | 9.0% |
| 10 | Land Rover Range Rover Sport | $65,716 | $5,440 | 9.0% |
| 11 | BMW Z4 | $47,558 | $3,920 | 9.0% |
| 12 | Cadillac CT5 | $35,711 | $2,867 | 8.7% |
| 13 | Chrysler Pacifica | $27,586 | $2,122 | 8.3% |
| 14 | Lexus LS 500 | $65,376 | $4,962 | 8.2% |
| 15 | Chevrolet Trax | $20,599 | $1,561 | 8.2% |
| 16 | Honda Pilot | $35,070 | $2,633 | 8.1% |
| 17 | Mercedes-Benz GLA | $32,100 | $2,334 | 7.8% |
| 18 | Nissan Armada | $39,280 | $2,746 | 7.5% |
| 19 | Porsche Cayenne (Hybrid) | $95,959 | $6,698 | 7.5% |
| 20 | Cadillac XT5 | $35,613 | $2,416 | 7.3% |
| Overall Average | $31,486 | -$667 | -2.1% | |
20 Fastest-Selling Used Cars
Four Teslas and three hybrids were among the top 10 fastest-selling models, while only one non-Tesla electric vehicle, the Lucid Air, made the top 20. The Tesla Model X ranked first, with the Cybertruck and Model Y, as well as the Lexus RX 350h, Honda Civic Hybrid, and Lexus ES 300h, making up six of the top 10 rankings.| Fastest-Selling Used Cars, March 2026 - iSeeCars Study | |||
| Rank | Model | Average Days on Market | Compared to Overall Average |
| 1 | Tesla Model X | 25.6 | 0.4x |
| 2 | Lexus RX 350h | 27.6 | 0.5x |
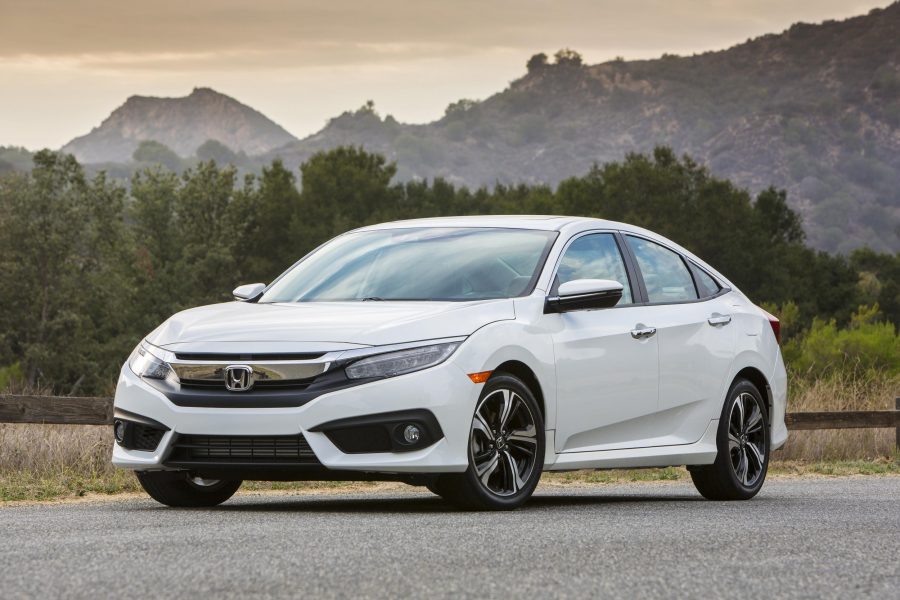
| 3 | Honda Civic Hybrid (Hatchback) | 29.6 | 0.5x |
| 4 | Lexus GX 550 | 31.0 | 0.5x |
| 5 | Lucid Air | 31.6 | 0.5x |
| 6 | Lexus ES 300h | 33.1 | 0.6x |
| 7 | Tesla Cybertruck | 33.3 | 0.6x |
| 8 | Audi Q5 Sportback | 34.2 | 0.6x |
| 9 | Tesla Model Y | 34.6 | 0.6x |
| 10 | Hyundai Elantra N | 38.3 | 0.7x |
| 11 | MINI Hardtop 2 Door | 38.7 | 0.7x |
| 12 | Mazda CX-50 Hybrid | 38.7 | 0.7x |
| 13 | Tesla Model S | 39.1 | 0.7x |
| 14 | Lexus RX 350 | 39.5 | 0.7x |
| 15 | Toyota Camry (Hybrid) | 39.5 | 0.7x |
| 16 | Lexus TX 350 | 39.6 | 0.7x |
| 17 | BMW Z4 | 40.0 | 0.7x |
| 18 | Toyota Grand Highlander Hybrid | 40.1 | 0.7x |
| 19 | Toyota Grand Highlander | 40.1 | 0.7x |
| 20 | Volkswagen Golf R | 40.4 | 0.7x |
| Overall Average | 58.8 | – | |
20 Slowest-Selling Used Cars
EVs make up four of the top 10 slowest-selling vehicles, though there are also four hybrids in the top 10 and seven in the top 20. A majority of the slow-selling hybrids come from luxury brands, suggesting a premium badge doesn’t help a hybrid’s desirability among used car shoppers.| Slowest-Selling Used Cars, March 2026 - iSeeCars Study | |||
| Rank | Model | Average Days on Market | Compared to Overall Average |
| 1 | Volvo XC60 (Hybrid) | 197.7 | 3.4x |
| 2 | GMC Sierra EV | 162.9 | 2.8x |
| 3 | Dodge Hornet (Hybrid) | 162.5 | 2.8x |
| 4 | Dodge Charger | 147.4 | 2.5x |
| 5 | Alfa Romeo Tonale Hybrid | 137.6 | 2.3x |
| 6 | Cadillac Escalade IQ | 130.3 | 2.2x |
| 7 | Chevrolet Silverado EV | 127.9 | 2.2x |
| 8 | Nissan Z | 120.3 | 2.0x |
| 9 | Volvo XC90 (Hybrid) | 118.5 | 2.0x |
| 10 | Chevrolet Blazer EV | 116.8 | 2.0x |
| 11 | BMW 2 Series | 116.5 | 2.0x |
| 12 | Alfa Romeo Giulia | 115.6 | 2.0x |
| 13 | Cadillac Escalade-V | 112.0 | 1.9x |
| 14 | GMC HUMMER EV (SUV) | 110.6 | 1.9x |
| 15 | Kia Sportage Plug-In Hybrid | 110.4 | 1.9x |
| 16 | Lincoln Nautilus Hybrid | 108.7 | 1.8x |
| 17 | Ford Escape Plug-In Hybrid | 107.5 | 1.8x |
| 18 | Jeep Grand Wagoneer | 107.0 | 1.8x |
| 19 | Cadillac XT6 | 104.7 | 1.8x |
| 20 | Dodge Hornet | 104.0 | 1.8x |
| Overall Average | 58.8 | – | |
Methodology
iSeeCars analyzed over 6.7 million 1- to 5-year-old used cars sold in January-March 2025 and January-March 2026 across three separate analyses. First, the share of cars from each drivetrain was analyzed and compared year-over-year. Second, the average listing prices of each car model were compared between the two time periods, and the differences were expressed as both a percentage difference as well as a dollar difference. Third, the number of days that each car was listed for sale on iSeeCars.com was aggregated, and the average days on market for each was mathematically modeled and compared across time periods. Heavy-duty vehicles and low-volume models were excluded from the latter two analyses. For both the pricing analysis and the days on market analysis, models discontinued as of one model year prior to the analysis period’s calendar year were excluded. Additionally for the pricing analysis, models in production for fewer than four of the last five model years for each period were also excluded.
About iSeeCars.com