Highlights:
- Consumers are fighting the high cost of newer cars by buying older models
- The market share of cars 10 years old or older has increased by 30 percent since 2014
- Despite their increased market share, the price of older cars has gone up by 60 percent since 2014
- Older sedans, wagons, and hatchbacks make up 16 of the 20 vehicles with the biggest growth in older car market share
Older vehicles make up a much larger portion of the used car market than they did a decade ago. Since 2014, the number of used cars being sold that are 10 years old or older has increased by 30 percent, with sedans, wagons, and hatchbacks leading the growth, according to a new study by iSeeCars.
The study analyzed over 169 million used cars sold from January 2014 to June 2024 to identify market trends with older cars, along with the 20 models gaining the most older car market share with shoppers.
The popularity of older cars (defined as used models that are 10 years old or older) reflects the rising cost of both new and late-model used cars, yet consumers are still paying substantially more for these older vehicles. The average price of an older car increased more than 60 percent, from $7,583 in 2014 to $12,194 today.
“Consumers seeking relief from high vehicle prices are turning to older cars,” said Karl Brauer, iSeeCars’ executive analyst. “But even going back a decade or more isn’t shielding buyers from the massive used car price hikes in recent years, with the average older car now costing more than $12,000.”
A Slight Dip Before the Rip in Older Car Market Share
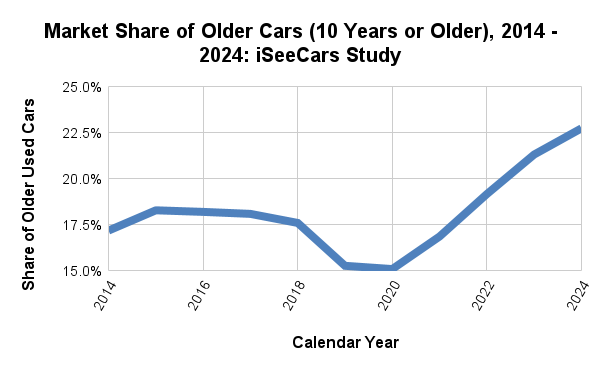
The share of older cars was fairly stable from 2014 to 2017, and even dipped between 2018 and 2020. But the last four years have seen a steady increase in old car share, moving from 15.1 percent of the market in 2020 to 22.7 percent this year. This same period saw older used car prices grow by $3,059, from $9,135 to $12,194.“The trend in vehicle prices represents an inescapable tidal wave,” said Brauer. “When you have new and lightly used car prices spiking, as they have over the past 4 years, there’s no stopping the wave’s impact on older cars, even for cars produced more than a decade ago.”
| Market Share of Older Cars: 2014 - 2024 – iSeeCars Study | ||
| Year | Market Share of Cars 10 Years or Older | Average Price of Cars 10 Years or Older |
| 2024 | 22.7% | $12,194 |
| 2023 | 21.3% | $12,230 |
| 2022 | 19.2% | $12,549 |
| 2021 | 16.9% | $11,105 |
| 2020 | 15.1% | $9,135 |
| 2019 | 15.3% | $8,923 |
| 2018 | 17.6% | $9,079 |
| 2017 | 18.1% | $8,865 |
| 2016 | 18.2% | $8,397 |
| 2015 | 18.3% | $7,918 |
| 2014 | 17.2% | $7,583 |
| % Change 2014 - 2024 | 32.4% | 60.8% |
Sedans, Wagons and Hatchbacks Are Popular With Older-Car Buyers
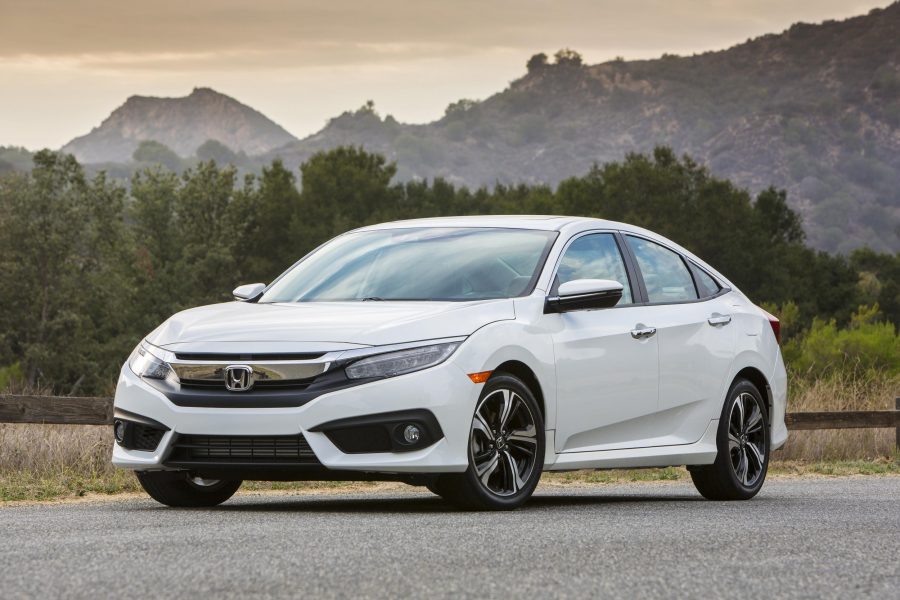
Sedans, wagons, and hatchbacks have consistently had lower demand and lower price points than trucks and SUVs. They also see less demanding use, allowing them to age more gracefully than larger utility vehicles. The result is increased share within the older car segment for used passenger cars, with models like the Hyundai Sonata, Subaru Legacy, and Mercedes-Benz C-Class more than tripling their older vehicle share.While the price for older cars has risen dramatically in recent years, used car shoppers can still get most of these sedans, wagons, and hatchbacks for around $10,000 or less.
| Vehicles With the Largest Growth in Older Car Market Share: 2014 to 2024 – iSeeCars Study | |||||||
| Rank | Model | Market Share of Cars 10 Years or Older, 2014 | Market Share of Cars 10 Years or Older, 2024 | % Change in Market Share, 2014 to 2024 | Average Price of Cars 10 Years or Older, 2014 | Average Price of Cars 10 Years or Older, 2024 | % Change in Price, 2014 to 2024 |
| 1 | Hyundai Sonata | 4.8% | 28.0% | 484.3% | $4,867 | $8,312 | 70.8% |
| 2 | Subaru Legacy | 6.6% | 27.4% | 316.8% | $5,556 | $8,871 | 59.7% |
| 3 | Subaru Impreza | 10.6% | 43.9% | 313.5% | $9,809 | $12,203 | 24.4% |
| 4 | Mercedes-Benz C-Class | 9.1% | 28.6% | 215.0% | $7,419 | $10,139 | 36.7% |
| 5 | Subaru Impreza (wagon) | 12.1% | 35.9% | 195.7% | $6,871 | $10,797 | 57.2% |
| 6 | Mercedes-Benz E-Class | 15.1% | 41.0% | 172.0% | $8,529 | $12,096 | 41.8% |
| 7 | Hyundai Elantra | 7.7% | 20.6% | 166.7% | $4,462 | $8,241 | 84.7% |
| 8 | BMW 3 Series | 12.6% | 30.2% | 139.0% | $7,305 | $10,180 | 39.3% |
| 9 | Nissan Altima | 8.6% | 20.5% | 137.0% | $5,432 | $8,023 | 47.7% |
| 10 | Honda Odyssey | 18.2% | 39.3% | 115.9% | $5,987 | $10,496 | 75.3% |
| 11 | Jeep Wrangler | 21.2% | 44.7% | 110.4% | $12,169 | $15,160 | 24.6% |
| 12 | BMW 5 Series | 14.3% | 30.1% | 110.1% | $8,164 | $11,161 | 36.7% |
| 13 | Volkswagen Jetta | 13.4% | 26.7% | 99.4% | $5,274 | $8,121 | 54.0% |
| 14 | Toyota Corolla | 11.8% | 21.9% | 85.3% | $5,683 | $9,562 | 68.3% |
| 15 | Honda Civic | 15.6% | 27.1% | 74.1% | $5,516 | $9,805 | 77.7% |
| 16 | Mazda MX-5 Miata | 31.5% | 51.9% | 64.8% | $6,988 | $13,083 | 87.2% |
| 17 | Honda Accord | 21.3% | 34.6% | 62.7% | $6,331 | $10,302 | 62.7% |
| 18 | Toyota Camry | 16.2% | 26.3% | 62.0% | $6,235 | $9,701 | 55.6% |
| 19 | Mercedes-Benz SL-Class | 41.1% | 65.3% | 59.0% | $18,885 | $23,226 | 23.0% |
| 20 | Nissan Sentra | 10.1% | 15.8% | 55.5% | $4,770 | $7,367 | 54.5% |
| Overall Average | 17.2% | 22.7% | 32.4% | $7,583 | $12,194 | 60.8% | |
Price is the primary factor driving growth in older vehicle market share, but an increase in vehicle durability and technology may also play a part. The average 10-year-old car on the market in 2024 is far more advanced, fuel efficient, and reliable than a 10-year-old car was in 2014, making older cars in 2024 easier to use and rely on for consumers looking to save money on their vehicle expenses.
Growth in Older Car Market Share in the Top 50 Largest Metro Areas
In the nation’s top 50 largest metro areas by population, the growth in older car share ranges from 106% in San Antonio, TX to -1.3% in Jacksonville, FL, the only large metro area with a drop in older car share.| Growth in Older Car Market Share, Top 50 Largest Metro Areas by Population: 2014 to 2024 – iSeeCars Study | |||||||
| Rank | Metro Area | Market Share of Cars 10 Years or Older, 2014 | Market Share of Cars 10 Years or Older, 2024 | % Change in Market Share, 2014 to 2024 | Average Price of Cars 10 Years or Older, 2014 | Average Price of Cars 10 Years or Older, 2024 | % Change in Price, 2014 to 2024 |
| 1 | San Antonio, TX | 7.7% | 15.8% | 106.0% | $8,295 | $12,881 | 55.3% |
| 2 | Houston, TX | 7.9% | 16.0% | 103.1% | $8,909 | $12,847 | 44.2% |
| 3 | Norfolk-Portsmouth-Newport News,VA | 14.8% | 29.4% | 98.7% | $8,011 | $10,487 | 30.9% |
| 4 | Washington, DC (Hagerstown, MD) | 11.3% | 20.1% | 77.9% | $7,849 | $11,850 | 51.0% |
| 5 | Phoenix, AZ | 11.4% | 19.6% | 71.4% | $8,815 | $14,144 | 60.5% |
| 6 | Raleigh-Durham (Fayetteville), NC | 11.6% | 19.7% | 70.2% | $7,803 | $11,787 | 51.1% |
| 7 | Albuquerque-Santa Fe, NM | 9.9% | 16.8% | 69.2% | $9,419 | $13,976 | 48.4% |
| 8 | Hartford & New Haven, CT | 13.2% | 22.3% | 68.6% | $7,493 | $12,121 | 61.8% |
| 9 | Detroit, MI | 11.3% | 18.9% | 68.3% | $6,432 | $10,565 | 64.3% |
| 10 | Dallas-Ft. Worth, TX | 9.0% | 15.0% | 67.1% | $8,224 | $13,730 | 67.0% |
| 11 | Birmingham, AL | 11.6% | 19.2% | 65.9% | $7,674 | $11,682 | 52.2% |
| 12 | San Diego, CA | 11.8% | 19.5% | 65.4% | $9,076 | $13,098 | 44.3% |
| 13 | Sacramento-Stockton-Modesto, CA | 15.9% | 26.1% | 64.6% | $9,112 | $12,085 | 32.6% |
| 14 | Pittsburgh, PA | 10.1% | 16.6% | 64.3% | $7,651 | $12,527 | 63.7% |
| 15 | St. Louis, MO | 11.7% | 19.1% | 62.8% | $7,720 | $12,181 | 57.8% |
| 16 | Kansas City, MO | 12.9% | 20.9% | 61.6% | $7,747 | $12,925 | 66.8% |
| 17 | Boston, MA-Manchester, NH | 10.5% | 17.0% | 61.4% | $7,685 | $12,731 | 65.7% |
| 18 | Greenville-Spartanburg, SC | 15.7% | 24.9% | 58.7% | $7,690 | $11,443 | 48.8% |
| 19 | San Francisco-Oakland-San Jose, CA | 12.2% | 18.8% | 54.3% | $9,125 | $13,283 | 45.6% |
| 20 | Grand Rapids-Kalamazoo, MI | 14.8% | 22.6% | 52.6% | $6,541 | $11,948 | 82.7% |
| 21 | Greensboro-Winston Salem, NC | 13.7% | 20.7% | 50.9% | $8,203 | $11,797 | 43.8% |
| 22 | Nashville, TN | 13.0% | 19.5% | 50.2% | $7,806 | $12,261 | 57.1% |
| 23 | Cincinnati, OH | 16.5% | 24.6% | 49.2% | $7,302 | $11,116 | 52.2% |
| 24 | Los Angeles, CA | 10.9% | 15.8% | 45.3% | $9,151 | $13,984 | 52.8% |
| 25 | Cleveland-Akron (Canton), OH | 15.8% | 22.8% | 44.6% | $6,689 | $11,160 | 66.8% |
| 26 | Baltimore, MD | 10.9% | 15.5% | 42.0% | $7,740 | $12,158 | 57.1% |
| 27 | Atlanta, GA | 12.6% | 17.7% | 40.8% | $7,806 | $12,518 | 60.4% |
| 28 | Louisville, KY | 16.7% | 23.3% | 39.9% | $7,073 | $11,729 | 65.8% |
| 29 | Philadelphia, PA | 13.4% | 18.7% | 39.5% | $7,298 | $12,282 | 68.3% |
| 30 | Charlotte, NC | 12.3% | 16.9% | 37.7% | $8,357 | $12,747 | 52.5% |
| 31 | Fresno-Visalia, CA | 10.3% | 14.1% | 36.9% | $9,454 | $13,325 | 40.9% |
| 32 | Las Vegas, NV | 12.5% | 17.1% | 36.9% | $8,299 | $12,819 | 54.5% |
| 33 | Harrisburg-Lancaster-York, PA | 17.1% | 23.2% | 35.2% | $7,981 | $11,789 | 47.7% |
| 34 | Minneapolis-St. Paul, MN | 16.5% | 22.2% | 35.1% | $6,583 | $11,428 | 73.6% |
| 35 | Columbus, OH | 15.8% | 20.9% | 32.9% | $7,118 | $11,037 | 55.1% |
| National Average | 17.2% | 22.7% | 32.4% | $7,583 | $12,194 | 60.8% | |
| 36 | Oklahoma City, OK | 12.6% | 16.6% | 31.9% | $6,718 | $12,393 | 84.5% |
| 37 | Chicago, IL | 15.6% | 20.5% | 31.6% | $6,946 | $11,891 | 71.2% |
| 38 | Indianapolis, IN | 17.9% | 22.7% | 26.5% | $6,912 | $11,660 | 68.7% |
| 39 | Denver, CO | 19.4% | 24.3% | 25.5% | $8,013 | $13,095 | 63.4% |
| 40 | Orlando-Daytona Beach, FL | 15.3% | 18.9% | 23.6% | $6,790 | $11,204 | 65.0% |
| 41 | New York, NY | 12.6% | 15.6% | 23.5% | $7,356 | $11,836 | 60.9% |
| 42 | Austin, TX | 10.6% | 13.0% | 22.6% | $7,736 | $13,159 | 70.1% |
| 43 | West Palm Beach-Ft. Pierce, FL | 11.9% | 14.5% | 21.4% | $8,081 | $14,815 | 83.3% |
| 44 | Milwaukee, WI | 15.6% | 18.3% | 17.3% | $7,141 | $11,718 | 64.1% |
| 45 | Miami-Ft. Lauderdale, FL | 10.8% | 12.6% | 16.5% | $7,499 | $14,616 | 94.9% |
| 46 | Salt Lake City, UT | 17.1% | 19.5% | 14.5% | $7,052 | $12,381 | 75.6% |
| 47 | Portland, OR | 19.9% | 22.3% | 12.4% | $8,408 | $12,512 | 48.8% |
| 48 | Tampa-St Petersburg (Sarasota), FL | 16.4% | 17.8% | 8.8% | $7,147 | $12,255 | 71.5% |
| 49 | Seattle-Tacoma, WA | 23.3% | 24.4% | 4.7% | $8,222 | $12,342 | 50.1% |
| 50 | Jacksonville, FL | 15.6% | 15.4% | -1.3% | $6,833 | $12,071 | 76.7% |
Methodology
iSeeCars analyzed over 169 million used cars sold from January 2014 - June 2024. The share of cars that were 10 years old or older was calculated for each calendar year, as well as for each model. For the model-level analysis, only non-heavy-duty cars in production as of the 2023 model year and continuously in production from the 1994 - 2023 model years were included.
About iSeeCars.com

