Highlights:
- 1- to 5-year-old used car sales have been slowing for the past seven months, taking an average of over 45 days to sell since August.
- February was the slowest month since January 2024, with the average used car taking 53 days to sell.
- The Tesla Model X, Mercedes-Benz EQS SUV, and Tesla Cybertruck are the three fastest-selling used cars.
- The Volvo XC60 plug-in hybrid, BMW i5, and Dodge Hornet plug-in hybrid are the three slowest-selling used cars.
- Four Teslas (Models X, 3, Y, and Cybertruck) are among the fastest-selling used cars.
- New cars are selling 3.2 days faster than used cars, that's 15% faster than a year ago compared to a 40.6% slowdown for used cars.
- The Chevrolet Bolt is the fastest-selling new car, taking an average of 9.6 days to sell, while the Hyundai Ioniq 5 N is the slowest at 196.0 days.
Used car prices have increased dramatically over the past 6 years, but consumer patience for their high cost may finally be wearing thin. The number of days the average 1- to 5-year-old used car takes to sell (days on market) has been increasing since August. Last month, the average used car took 53 days to sell – a 40.6% jump from a year earlier, and the highest days on market in over two years, since January 2024.
“Used car prices have stabilized over the past 18 months, and they actually dropped slightly in January and February,” said iSeeCars Executive Analyst Karl Brauer. “But it’s still taking longer to sell these cars, as more consumers either hang on to their current vehicle or shop for older used models to save money.”
Used Cars Now Languishing on the Lot
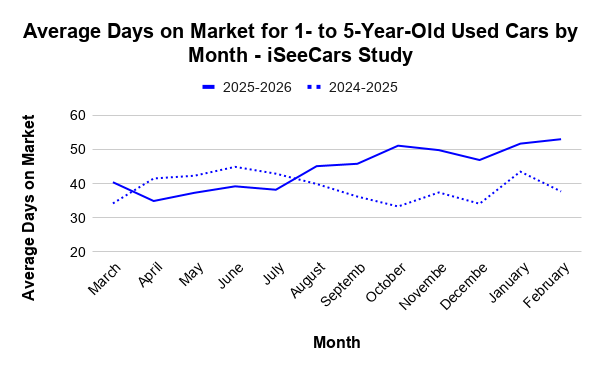
A year ago in February 2025, the average 1- to 5-year-old used car was sitting on dealer lots for 37.7 days. But since August, the monthly average days on market has increased to 40 to 50 days. In October 2025, the days on market increased 53.5% compared to a year earlier, and last month (February 2026) it increased 40.6%.| Average Days on Market for 1- to 5-Year-Old Used Cars By Month - iSeeCars Study | ||||
| Year | Month | Days on Market | Days on Market, Previous Year | % Difference Year-over-Year |
| 2026 | February | 53.0 | 37.7 | 40.6% |
| 2026 | January | 51.7 | 43.5 | 18.9% |
| 2025 | December | 46.9 | 34.1 | 37.5% |
| 2025 | November | 49.8 | 37.4 | 33.2% |
| 2025 | October | 51.1 | 33.3 | 53.5% |
| 2025 | September | 45.8 | 36.2 | 26.5% |
| 2025 | August | 45.1 | 39.9 | 13.0% |
| 2025 | July | 38.2 | 42.9 | -11.0% |
| 2025 | June | 39.2 | 44.9 | -12.7% |
| 2025 | May | 37.3 | 42.3 | -11.8% |
| 2025 | April | 34.9 | 41.5 | -15.9% |
| 2025 | March | 40.4 | 34.2 | 18.1% |
Used EVs Are Selling Faster Than Traditional Cars, But Sales Are Still Slowing
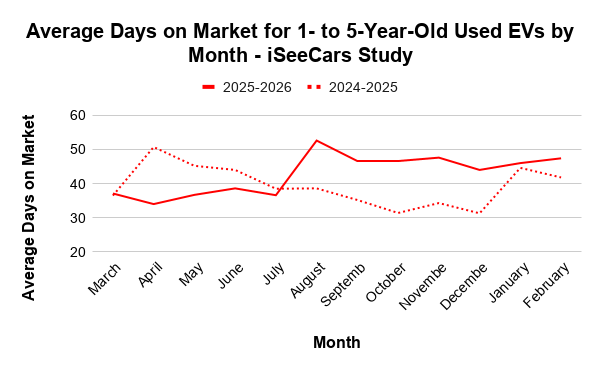
Used electric vehicles are selling faster than the average car, with February’s EV number at 47.4 days compared to the overall average of 53 days on market. But used EVs are also taking longer to sell than before, with increases in monthly average days-on-market year-over-year starting in August. In October 2025 used EVs took 48.4% longer to sell than in 2024, and last month used EVs took 13.4% longer to sell compared to February 2025.| Average Days on Market for 1- to 5-Year-Old Used EVs By Month - iSeeCars Study | ||||
| Year | Month | Days on Market | Days on Market, Previous Year | % Difference Year-over-Year |
| 2026 | February | 47.4 | 41.8 | 13.4% |
| 2026 | January | 46.0 | 44.6 | 3.1% |
| 2025 | December | 44.0 | 31.3 | 40.6% |
| 2025 | November | 47.6 | 34.3 | 38.8% |
| 2025 | October | 46.6 | 31.4 | 48.4% |
| 2025 | September | 46.6 | 35.2 | 32.4% |
| 2025 | August | 52.6 | 38.6 | 36.3% |
| 2025 | July | 36.6 | 38.5 | -4.9% |
| 2025 | June | 38.6 | 44.0 | -12.3% |
| 2025 | May | 36.7 | 45.2 | -18.8% |
| 2025 | April | 34.0 | 50.7 | -32.9% |
| 2025 | March | 37.1 | 36.5 | 1.6% |
Used Tesla Demand Is Keeping Overall Used EV Numbers Strong
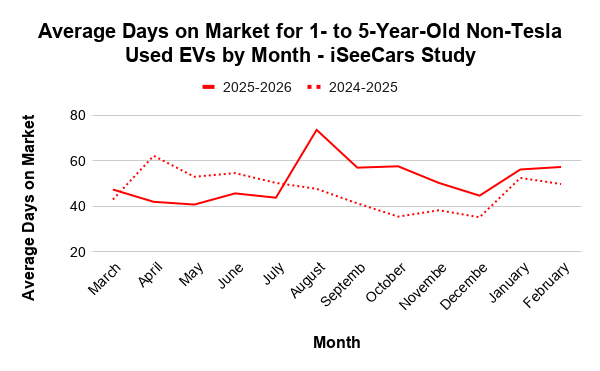
It’s worth noting that Tesla still makes up the bulk of used EV sales, and that’s why used EVs appear to be selling faster than used cars overall: Tesla's rapid sales are pulling the average EV days on market down.The table and chart below show what happens when used EVs, excluding Tesla sales, are calculated. The days on market numbers over the past 7 months shift from the mid- to high 40s to the mid- to high 50s.
| Average Days on Market for 1- to 5-Year-Old Used Non-Tesla EVs By Month - iSeeCars Study | ||||
| Year | Month | Days on Market | Days on Market, Previous Year | % Difference Year-over-Year |
| 2026 | February | 57.3 | 49.8 | 15.1% |
| 2026 | January | 56.2 | 52.5 | 7.0% |
| 2025 | December | 44.7 | 35.2 | 27.0% |
| 2025 | November | 50.3 | 38.3 | 31.3% |
| 2025 | October | 57.6 | 35.5 | 62.3% |
| 2025 | September | 57.0 | 41.3 | 38.0% |
| 2025 | August | 73.6 | 47.7 | 54.3% |
| 2025 | July | 43.8 | 50.3 | -12.9% |
| 2025 | June | 45.7 | 54.6 | -16.3% |
| 2025 | May | 40.8 | 53.0 | -23.0% |
| 2025 | April | 42.0 | 62.2 | -32.5% |
| 2025 | March | 47.4 | 43.0 | 10.2% |
The 20 Fastest-Selling Used Cars
The fastest-selling used cars are a mix of electric, hybrid, and traditional models, including four Teslas and many high-performance or sports cars like the BMW M2, Mazda Miata, Toyota Supra, and Volkswagen Golf R. These models all sold substantially faster than the 53-day average in February.| Fastest-Selling 1- to 5-Year-Old Used Cars: February 2026 - iSeeCars Study | |||
| Rank | Model | Days on Market | Compared to Average |
| 1 | Tesla Model X | 22.6 | 0.43x |
| 2 | Mercedes-Benz EQS (suv) | 26.9 | 0.51x |
| 3 | Tesla Cybertruck | 27.4 | 0.52x |
| 4 | Mazda MX-5 Miata RF | 29.3 | 0.55x |
| 5 | Toyota GR Supra | 30.0 | 0.57x |
| 6 | Genesis G90 | 30.4 | 0.57x |
| 7 | Rivian R1S | 30.8 | 0.58x |
| 8 | Toyota GR Corolla | 31.1 | 0.59x |
| 9 | Hyundai Kona Electric | 31.4 | 0.59x |
| 10 | Volkswagen Golf R | 31.8 | 0.60x |
| 11 | Lexus GX 550 | 32.4 | 0.61x |
| 12 | Lexus RX 500h | 33.0 | 0.62x |
| 13 | Tesla Model 3 | 33.1 | 0.62x |
| 14 | Nissan LEAF | 33.8 | 0.64x |
| 15 | Honda Civic Hybrid | 34.8 | 0.66x |
| 16 | Tesla Model Y | 34.9 | 0.66x |
| 17 | Toyota GR86 | 35.1 | 0.66x |
| 18 | BMW M2 | 35.4 | 0.67x |
| 19 | BMW X5 M | 35.5 | 0.67x |
| 20 | Cadillac Escalade-V | 35.6 | 0.67x |
| Overall Used Average | 53.0 | -- | |
The 20 Slowest-Selling Used Cars
With nine electric vehicles among the slowest-selling used cars, it further demonstrates that many EVs are struggling to sell, even as Teslas and a few non-Tesla EVs (Hyundai Kona, Mercedes-Benz EQS, Nissan LEAF, and Rivian R1s) remain popular with used shoppers. Add in hybrid models, and 15 of the 20 slowest-selling used models are alternative fuel vehicles.| Slowest-Selling 1- to 5-Year-Old Used Cars: February 2026 - iSeeCars Study | |||
| Rank | Model | Days on Market | Compared to Average |
| 1 | Volvo XC60 (hybrid) | 170.2 | 3.21x |
| 2 | BMW i5 (electric) | 153.0 | 2.89x |
| 3 | Dodge Hornet (hybrid) | 123.7 | 2.33x |
| 4 | Lincoln Nautilus Hybrid | 118.0 | 2.23x |
| 5 | GMC Sierra EV | 116.1 | 2.19x |
| 6 | Ford Escape Plug-In Hybrid | 112.3 | 2.12x |
| 7 | Volvo XC90 (hybrid) | 108.7 | 2.05x |
| 8 | Nissan Z | 107.9 | 2.04x |
| 9 | Genesis GV60 | 101.6 | 1.92x |
| 10 | Land Rover Discovery | 101.5 | 1.92x |
| 11 | Dodge Charger (electric) | 96.7 | 1.82x |
| 12 | Chevrolet Blazer EV | 96.3 | 1.82x |
| 13 | Cadillac Escalade IQ | 93.8 | 1.77x |
| 14 | Cadillac XT6 | 91.6 | 1.73x |
| 15 | BMW 8 Series | 91.4 | 1.72x |
| 16 | Lincoln Corsair (hybrid) | 90.6 | 1.71x |
| 17 | Chevrolet Silverado EV | 87.7 | 1.65x |
| 18 | Cadillac LYRIQ | 87.4 | 1.65x |
| 19 | GMC HUMMER EV (suv) | 87.2 | 1.65x |
| 20 | Dodge Hornet | 87.2 | 1.65x |
| Overall Used Average | 53.0 | -- | |
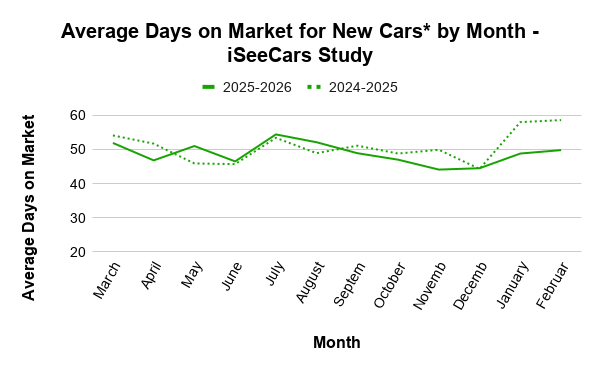
New Cars Selling Faster Than Used
Unlike used cars, new cars are selling closer to the same rate as they did a year ago. There has been a 15% increase in new car sales in the past two months, with new cars averaging less than 50 days on market since September.| Monthly Average Days on Market for 1- to 5-Year-Old New Cars* - iSeeCars Study | ||||
| Year | Month | Days on Market | Days on Market, Previous Year | % Difference Year-over-Year |
| 2026 | February | 49.8 | 58.6 | -15.0% |
| 2026 | January | 48.8 | 58.0 | -15.9% |
| 2025 | December | 44.5 | 44.3 | 0.5% |
| 2025 | November | 44.1 | 49.9 | -11.6% |
| 2025 | October | 47.0 | 48.8 | -3.7% |
| 2025 | September | 48.9 | 51.1 | -4.3% |
| 2025 | August | 52.1 | 48.9 | 6.5% |
| 2025 | July | 54.4 | 53.4 | 1.9% |
| 2025 | June | 46.5 | 45.7 | 1.8% |
| 2025 | May | 51.0 | 45.9 | 11.1% |
| 2025 | April | 46.8 | 51.7 | -9.5% |
| 2025 | March | 51.9 | 54.1 | -4.1% |
“Until recently new car sales had been pretty stable in terms of speed,” said Brauer. “But January and February saw the biggest increase in sales rate over the past year, suggesting we may be at the start of rising new-car demand.”
The 20 Fastest-Selling New Cars
Chevrolet’s recently re-introduced Bolt is the fastest-selling new car, followed by the Lexus LC500 convertible, Kia K4, and Porsche 911. Porsche is actually the most prominent brand in the top 20 fastest-selling cars, with 9 models making an appearance.| Fastest-Selling 1- to 5-Year-Old New Cars: February 2026* - iSeeCars Study | |||
| Rank | Model | Days on Market | Compared to Average |
| 1 | Chevrolet Bolt | 9.6 | 0.19x |
| 2 | Lexus LC 500 Convertible | 10.7 | 0.21x |
| 3 | Kia K4 | 13.1 | 0.26x |
| 4 | Porsche 911 (hybrid convertible) | 13.5 | 0.27x |
| 5 | Lexus TX 550h+ | 13.8 | 0.28x |
| 6 | Porsche 911 (convertible) | 14.7 | 0.30x |
| 7 | Toyota Grand Highlander Hybrid | 14.9 | 0.30x |
| 8 | Toyota RAV4 (hybrid) | 15.3 | 0.31x |
| 9 | Porsche Macan | 15.3 | 0.31x |
| 10 | Toyota Grand Highlander | 15.5 | 0.31x |
| 11 | Toyota Sienna (hybrid) | 16.0 | 0.32x |
| 12 | Porsche Panamera (hybrid) | 16.0 | 0.32x |
| 13 | Porsche Cayenne (hybrid) | 16.3 | 0.33x |
| 14 | Porsche 911 | 16.3 | 0.33x |
| 15 | Toyota Highlander Hybrid | 16.5 | 0.33x |
| 16 | Porsche Macan | 16.8 | 0.34x |
| 17 | Porsche Cayenne | 17.3 | 0.35x |
| 18 | Porsche 911 (hybrid) | 17.8 | 0.36x |
| 19 | Cadillac Escalade-V | 18.0 | 0.36x |
| 20 | Lexus GX 550 | 18.7 | 0.38x |
| Overall New Average | 49.8 | -- | |
“It’s interesting to note that the fastest-selling new car is the Chevrolet Bolt, a car that just came back to market,” said Brauer. “The Bolt is followed by the Lexus LC 500, a car likely to leave the market soon.”
The 20 Slowest-Selling New Cars
The slowest selling new cars range from electric models like the Hyundai Ioniq 5 N and Volkswagen ID. Buzz to performance luxury models like the Audi RS 7 and Mercedes-Benz AMG GT. The three slowest-selling models are taking between three and four times as long to sell as the average new vehicle.| Slowest-Selling 1- to 5-Year-Old New Cars: February 2026* - iSeeCars Study | |||
| Rank | Model | Days on Market | Compared to Average |
| 1 | Hyundai Ioniq 5 N | 196.0 | 3.94x |
| 2 | Acura TLX | 152.7 | 3.07x |
| 3 | Audi A8 L | 150.1 | 3.01x |
| 4 | Mercedes-Benz GLC | 142.6 | 2.86x |
| 5 | Lexus ES 300h | 135.6 | 2.72x |
| 6 | Nissan Kicks Play | 120.0 | 2.41x |
| 7 | Volkswagen ID. Buzz | 119.3 | 2.40x |
| 8 | INFINITI QX50 | 116.0 | 2.33x |
| 9 | Audi S6 Sportback e-Tron | 115.8 | 2.33x |
| 10 | Nissan Altima | 112.1 | 2.25x |
| 11 | Subaru Legacy | 112.0 | 2.25x |
| 12 | Jeep Wagoneer S | 109.3 | 2.19x |
| 13 | Audi RS 7 Performance | 105.8 | 2.12x |
| 14 | Dodge Charger (EV) | 104.6 | 2.10x |
| 15 | Cadillac Escalade iQ | 102.7 | 2.06x |
| 16 | Audi Q3 | 102.6 | 2.06x |
| 17 | Volkswagen Taos | 100.6 | 2.02x |
| 18 | Alfa Romeo Stelvio | 99.9 | 2.01x |
| 19 | Kia Soul | 98.0 | 1.97x |
| 20 | Mercedes-Benz AMG GT | 97.6 | 1.96x |
| Overall New Average | 49.8 | -- | |
“Prices for new and used cars won’t drop until demand falls and dealers are forced to cut prices. We’re seeing a consistent slowdown in used car sales, but also what could be the start of rising new car demand,” said Brauer. “If the used car trend continues, we may finally see real transaction price cuts on the majority of used models.”
Methodology
iSeeCars analyzed over 960,000 1- to 5-year-old used car sales and over 790 new cars sales from February 2026. The number of days that each car was listed for sale on iSeeCars.com was aggregated at the make and model levels, and the average days on market for each was mathematically modeled. Tesla sales were not included in the new car sales data. Heavy-duty vehicles, models no longer in production prior to the 2025 model year, and low-volume models were excluded from further analysis.
About iSeeCars.com