Highlights:
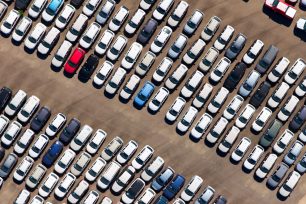
- White is the most popular car color, with 25.7% market share, followed closely by black and gray
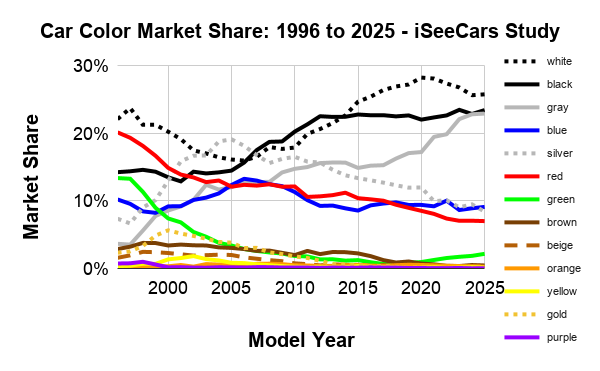
- Gray made the biggest gain in popularity over the past 30 years, rising from 3.6% market share in 1996 to 22.9% in 2025
- Grayscale colors (white, black, gray, and silver) now make up 80.4% of the car market, up from 47.3% in 1996
- Red and green now appear on fewer than one in 10 vehicles, with their combined market share falling from 33.5% in 1996 to 9.2% in 2025
- Grayscale colors are most popular in the truck category, with 83.5% market share
- The most colorful category is sports cars, with 36.2% market share for non-grayscale colors
White was the most popular car color 30 years ago and it maintains that ranking today. When combined with the prominence of black (23.4%) and gray (22.9%), the top three most popular colors hold 72% of market share for modern car colors. It’s worth noting that silver, the fourth grayscale color, has gained just over 1 percentage point in popularity over the past 30 years, moving from 7.3% to 8.4% market share since 1996. Silver now trails blue, which holds 9.1% market share.
| Most Popular Car Colors by Market Share: 2025 vs. 1996 - iSeeCars Study | ||||
| Rank | Color | 2025 | 1996 | % Change |
| 1 | White | 25.7% | 22.1% | 16.7% |
| 2 | Black | 23.4% | 14.2% | 64.5% |
| 3 | Gray | 22.9% | 3.6% | 528.4% |
| 4 | Blue | 9.1% | 10.2% | -10.8% |
| 5 | Silver | 8.4% | 7.3% | 14.3% |
| 6 | Red | 7.0% | 20.1% | -65.2% |
| 7 | Green | 2.2% | 13.4% | -83.8% |
| 8 | Brown | 0.4% | 2.9% | -84.6% |
| 9 | Beige | 0.4% | 1.6% | -73.8% |
| 10 | Orange | 0.3% | 0.2% | 2.5% |
| 11 | Yellow | 0.1% | 0.3% | -59.4% |
| 12 | Gold | 0.0% | 2.3% | -98.1% |
| 13 | Purple | 0.0% | 0.7% | -94.7% |
| Grayscale colors* | 80.4% | 47.3% | 70.1% | |
| Non-grayscale colors | 19.6% | 51.7% | -62.2% | |
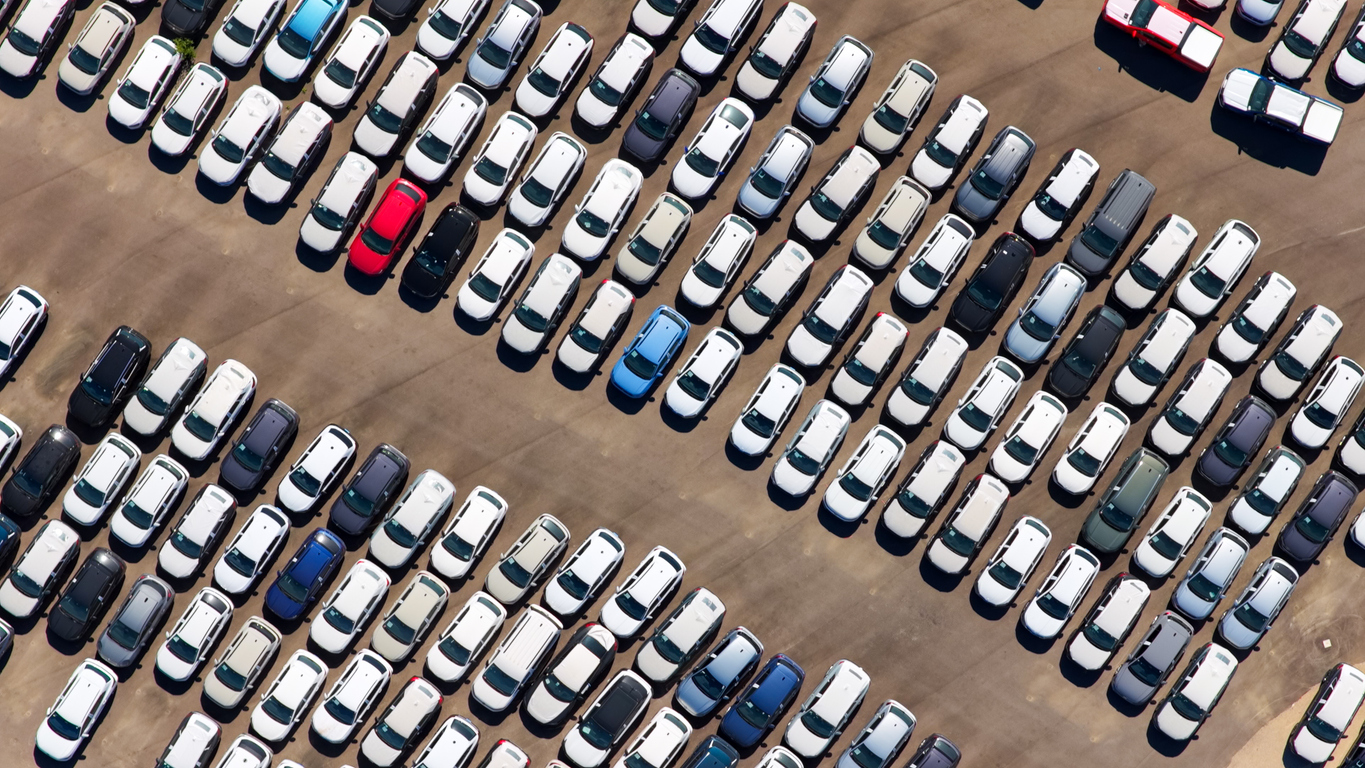
iSeeCars analyzed the colors of over 22 million used cars from model years 1996 - 2025 sold from January 2025 to May 2026 to determine the market share for each color.
Grayscale colors dominate today’s market
Grayscale colors now account for 80.4% of the car market, while once-prominent colors such as red and green have lost a substantial amount of market share. After nearly three decades of steady growth, grayscale market share has remained close to 80% since the 2020 model year, suggesting the long-running prominence of grayscale cars may have reached its limit.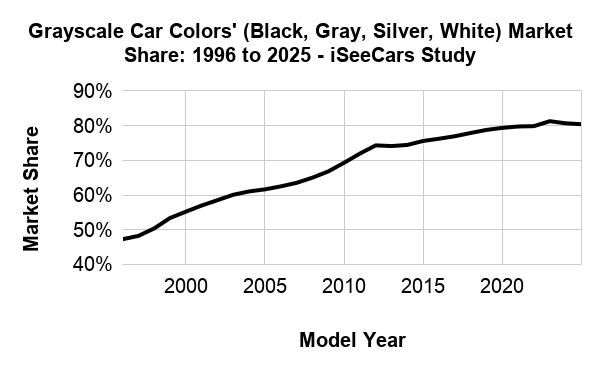 “Up until a few years ago it looked like non-grayscale cars would completely vanish,” said iSeeCars Executive Analyst Karl Brauer. “But the market share of grayscale cars finally stabilized in 2020, at around 80%, suggesting we’ll see at least a sliver of creative car colors going forward.”
Annual trends for individual colors
The movement toward grayscale developed in stages, rather than through the steady rise of a single color. Silver was an early beneficiary, increasing from 7.3% market share for the 1996 model year to roughly 19% in the mid-2000s before declining to 8.4% by the 2025 model year.Gray followed a different path, increasing in market share consistently through the entire period, ultimately rising from only 3.6% to 22.9% and nearly matching black.
Black and white, which were always popular colors, also gained substantial market share, with black’s popularity growing mostly in the early 2000s’ model years and white gaining share starting in the 2010 model year. Conversely, red and green, which ranked as the 2nd and 4th most popular colors in the 1996 model year, declined substantially throughout much of the 30-year period, with each color’s market share now in single digits. Most other colors either lost what little market share they had or maintained their relatively low popularity. Orange was the only non-grayscale color to increase in popularity, though it remains rare at just 0.3% market share.
“The rise of grayscale cars had to come from somewhere, and it was primarily the fall of red and green, though nearly every non-grayscale shade has lost ground since 1996,” said Brauer.
Trucks: Grayscale colors nearly doubled
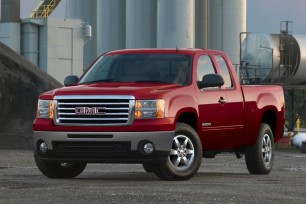
Trucks have undergone the largest move toward grayscale colors of any vehicle category. Black, gray, silver, and white increased from 43.4% of 1996 trucks to 83.5% of the 2025 model year, almost doubling in market share. White is the clear leader at 33.6%. This is a higher share for white than the overall market, and it means more than one in three trucks now has a white finish. Red, blue, and green, which collectively represented nearly half of 1996 trucks, account for less than 15% of late-model trucks.| Most Popular Truck Colors by Market Share: 2025 vs. 1996 - iSeeCars Study | ||||
| Rank | Color | 2025 | 1996 | % Change |
| 1 | White | 33.6% | 27.0% | 24.6% |
| 2 | Black | 23.4% | 9.7% | 141.8% |
| 3 | Gray | 19.2% | 3.4% | 464.9% |
| 4 | Red | 7.6% | 21.4% | -64.7% |
| 5 | Silver | 7.3% | 3.3% | 118.4% |
| 6 | Blue | 6.3% | 12.6% | -50.3% |
| 7 | Green | 1.0% | 14.5% | -92.8% |
| 8 | Brown | 0.9% | 3.7% | -76.2% |
| 9 | Orange | 0.4% | 0.0% | 681.6% |
| 10 | Beige | 0.3% | 1.0% | -66.5% |
| 11 | Yellow | 0.0% | 0.2% | -93.6% |
| 12 | Gold | 0.0% | 1.5% | -99.5% |
| 13 | Purple | 0.0% | 0.3% | -99.3% |
| Grayscale colors* | 83.5% | 43.4% | 92.4% | |
| Non-grayscale colors | 16.5% | 55.3% | -70.2% | |
“Trucks are seeing much more than a touch of gray, with the segment going from less than 1 gray truck in 20 in 1996 to 1 in 5 today,” said Brauer.
SUVs: Green and red lose the most ground
SUVs have also shifted from being relatively colorful to being dominated by white, black, gray, and silver. Grayscale colors rose from 43.8% of SUVs in 1996 to 79.3% in 2025, an increase of 80.9%. Green, which ranked second on 1996 SUVs with a 21.3% share, now represents only 2.9% of 2025 SUVs. Red also fell sharply, while blue remained comparatively stable and increased slightly to 9.5%.| Most Popular SUV Colors by Market Share: 2025 vs. 1996 - iSeeCars Study | ||||
| Rank | Color | 2025 | 1996 | % Change |
| 1 | White | 25.1% | 22.2% | 12.8% |
| 2 | Black | 23.4% | 14.5% | 61.5% |
| 3 | Gray | 21.9% | 4.0% | 444.7% |
| 4 | Blue | 9.5% | 8.8% | 8.4% |
| 5 | Silver | 8.9% | 3.1% | 189.7% |
| 6 | Red | 6.8% | 17.5% | -61.0% |
| 7 | Green | 2.9% | 21.3% | -86.4% |
| 8 | Brown | 0.5% | 3.8% | -86.7% |
| 9 | Beige | 0.5% | 1.7% | -73.2% |
| 10 | Orange | 0.3% | 0.3% | -10.0% |
| 11 | Yellow | 0.1% | 0.2% | -28.4% |
| 12 | Gold | 0.1% | 1.3% | -95.7% |
| 13 | Purple | 0.0% | 0.4% | -94.6% |
| Grayscale colors* | 79.3% | 43.8% | 80.9% | |
| Non-grayscale colors | 20.7% | 55.2% | -62.6% | |
“SUV market share has grown more than any other vehicle segment since 1996, but SUV color diversity went the opposite direction during that timeframe,” said Brauer.
Passenger cars: Gray grows, silver declines
Passenger cars have embraced gray more strongly than any other vehicle category. Gray increased from just 3.8% of passenger cars from the 1996 model year to 28.4% for 2025, a relative increase of 652.1%. It now leads both black and white. Silver moved in the opposite direction, declining from 11.2% to 7.4%, while red and green also lost substantial share.| Most Popular Passenger Car Colors by Market Share: 2025 vs. 1996 - iSeeCars Study | ||||
| Rank | Color | 2025 | 1996 | % Change |
| 1 | Gray | 28.4% | 3.8% | 652.1% |
| 2 | Black | 23.7% | 17.5% | 35.0% |
| 3 | White | 21.2% | 17.8% | 19.2% |
| 4 | Blue | 9.9% | 9.1% | 9.3% |
| 5 | Silver | 7.4% | 11.2% | -34.3% |
| 6 | Red | 7.1% | 20.2% | -64.7% |
| 7 | Green | 1.0% | 10.1% | -89.6% |
| 8 | Beige | 0.5% | 2.1% | -78.0% |
| 9 | Orange | 0.2% | 0.4% | -41.8% |
| 10 | Yellow | 0.2% | 0.4% | -50.4% |
| 11 | Brown | 0.1% | 2.3% | -94.1% |
| 12 | Purple | 0.1% | 1.1% | -88.7% |
| 13 | Gold | 0.0% | 3.3% | -98.7% |
| Grayscale colors* | 80.7% | 50.3% | 60.4% | |
| Non-grayscale colors | 19.3% | 48.9% | -60.6% | |
“Gray has gained ground in every vehicle segment, and it’s the most dominant color for today’s passenger cars,” said Brauer.
Sports cars: The most colorful category
Sports cars remain the clearest exception to the increasingly grayscale vehicle market. Non-grayscale colors account for 36.2% of sports cars, nearly twice their 19.6% share across the overall market. Blue, yellow, purple, and orange all gained share. Red declined substantially but remains more common among sports cars than in any other category, appearing on 10.8% of the segment.| Most Popular Sports Car Colors by Market Share: 2025 vs. 1996 - iSeeCars Study | ||||
| Rank | Color | 2025 | 1996 | % Change |
| 1 | Gray | 21.2% | 3.0% | 598.0% |
| 2 | Black | 20.9% | 20.5% | 1.9% |
| 3 | White | 16.6% | 14.1% | 17.4% |
| 4 | Blue | 15.5% | 9.9% | 56.7% |
| 5 | Red | 10.8% | 23.4% | -54.1% |
| 6 | Silver | 4.9% | 17.4% | -71.9% |
| 7 | Green | 4.5% | 7.5% | -40.3% |
| 8 | Yellow | 2.3% | 1.0% | 142.5% |
| 9 | Purple | 1.8% | 1.2% | 52.1% |
| 10 | Orange | 0.8% | 0.6% | 38.6% |
| 11 | Brown | 0.2% | 0.4% | -60.9% |
| 12 | Gold | 0.2% | 0.3% | -37.2% |
| 13 | Beige | 0.1% | 0.3% | -44.1% |
| Grayscale colors* | 63.6% | 55.0% | 15.5% | |
| Non-grayscale colors | 36.2% | 44.5% | -18.7% | |
“Relative to every other vehicle segment, sports cars still offer a veritable rainbow of color diversity, illustrating the expressive nature of these vehicles and their owners,” said Brauer.
Will we ever go back to a colorful car culture?
The vehicle market has changed from one with a broad mix of colors to one overwhelmingly concentrated around white, black, silver, and gray. While the combined grayscale share has stopped rising as quickly as it once did, colorful vehicles remain far less common than they were 30 years ago. Sports cars provide the strongest evidence that color still has a place in the market, while trucks, SUVs, and passenger cars continue to favor neutral finishes. “Does the recent grayscale plateau signal the beginning of a return to more expressive colors across all segments?” asked Brauer. “That will depend on the paint choices automakers offer and the car colors consumers demand in the years ahead.”
Methodology
iSeeCars analyzed the colors of over 22 million used cars from model years 1996 - 2025 sold from January 2025 to May 2026. The share of each color within each model year was calculated, as was the difference in share between model years 1996 and 2025.
About iSeeCars.com