Which slow-selling models are most likely to bring negotiation opportunities?
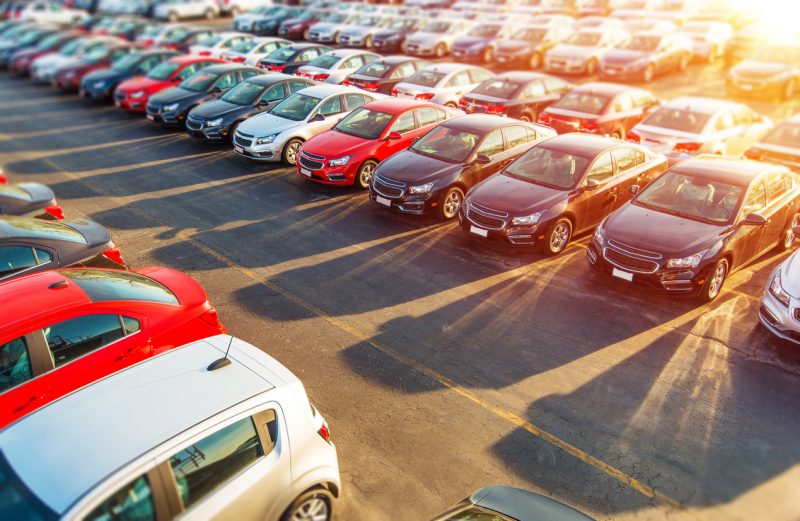
Car sales have decreased dramatically in the wake of COVID-19 due to social distancing measures and the economic downturn. However, some car models have been more impacted than others.iSeeCars analyzed over 1.8 million used cars for sale in February and March 2020 to determine which models have the most significant slowdown in sales, i.e. models with the largest drop in the percentage of cars sold within a month of being listed. These vehicles present prime negotiation opportunities for consumers who are in the market for a used car.
“Overall car sales have plummeted as a result of stay-at-home orders and the economic downturn,” said iSeeCars CEO Phong Ly. “But for those fortunate enough to be able to make a car purchase, now is an opportune time as dealers increasingly need to move inventory, and these slow-selling models could present great deals.”
| iSeeCars Top 15 Cars With Greatest Slowdown in Sales | ||||
| Rank | Vehicle | % Sold w/in 30 days Feb 2020 | % Sold w/in 30 days Mar 2020 | 2020 Feb – Mar % Sold diff |
| 1 | Tesla Model 3 | 71.5% | 47.4% | -24.2% |
| 2 | Toyota RAV4 Hybrid | 62.2% | 41.3% | -20.9% |
| 3 | Volkswagen Atlas | 64.7% | 45.3% | -19.4% |
| 4 | Mitsubishi Eclipse Cross | 53.9% | 34.9% | -19.0% |
| 5 | Tesla Model X | 57.9% | 40.4% | -17.5% |
| 6 | Chevrolet Spark | 62.6% | 45.4% | -17.1% |
| 7 | Toyota RAV4 | 60.0% | 43.2% | -16.8% |
| 8 | Toyota C-HR | 54.0% | 37.2% | -16.8% |
| 9 | Lexus GX 460 | 58.4% | 41.7% | -16.7% |
| 10 | Honda HR-V | 53.0% | 36.4% | -16.6% |
| 11 | Honda Pilot | 59.7% | 43.4% | -16.2% |
| 12 | Toyota Highlander | 64.1% | 47.9% | -16.1% |
| 13 | Honda Civic | 65.1% | 49.1% | -15.9% |
| 14 | Honda Odyssey | 63.4% | 47.6% | -15.8% |
| 15 | Honda CR-V | 57.8% | 42.1% | -15.7% |
| Overall Average | -9.8% | |||
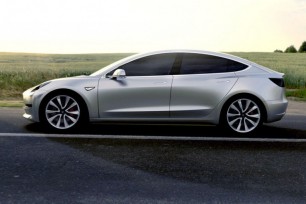
The top model with the greatest slowdown in sales between February and March is the Tesla Model 3 electric vehicle, with a drop of almost 25 percentage points from February to March for its inventory selling within 30 days of being listed. “The Tesla Model 3 is typically in very high demand, and as a result, it is the used car with the best resale value,” said Ly. “However, because they are lingering on lots now is the time when dealers may offer more deals than usual.” A second Tesla model, the Model X, makes the list as the car with the fifth-greatest slowdown in sales. “Like the Model 3, the Model X is also in high demand,” said Ly. “The Model X is the most expensive vehicle on the list, with an average price of $70,162 for three-year-old versions. Demand may additionally be lowered because potential buyers could be waiting for the release of the lower-priced Model Y SUV that started deliveries in March 2020.”
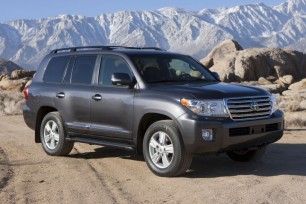
Four Toyota SUVs make the list including the second-ranked Toyota RAV4 Hybrid, the seventh-ranked Toyota RAV4, the eighth-ranked Toyota CH-R, and the twelfth-ranked Toyota Highlander. “The Toyota RAV4 and the Toyota Highlander are two of the best-selling SUVs in America, while the Toyota RAV4 Hybrid saw supply shortages in 2019 due to its popularity,” said Ly. “The popularity of these vehicles is largely due to Toyota’s reliability, which makes these vehicles smart buys.” A vehicle from Toyota’s luxury extension, Lexus, is the lone luxury vehicle on the list with the GX 460. “Those who want a luxury off-road SUV can likely get a great deal on the Lexus GX 460,” Ly commented.
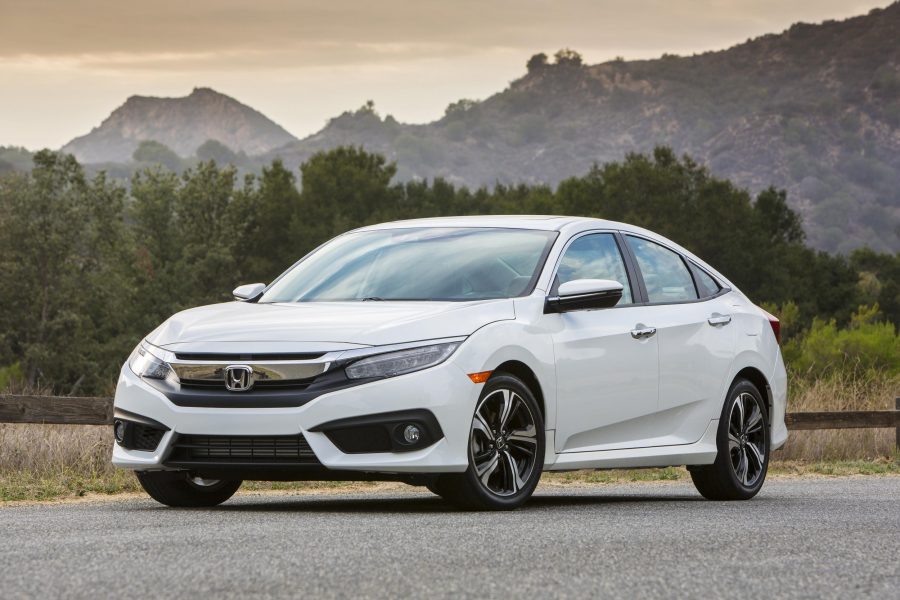
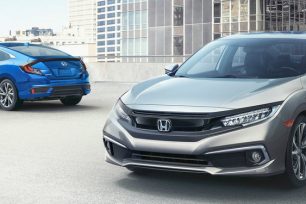
Honda is the most represented car brand on the list with five vehicles: the tenth-ranked HR-V, the eleventh-ranked Pilot, the thirteenth-ranked Civic, the fourteenth-ranked Odyssey, and the fifteenth-ranked CR-V. “These vehicles are all leaders in their classes thanks to their safety and proven longevity,” said Ly. “It shows that popular models across all vehicle types are seeing significant changes in selling times, which could bring deals to those who want a reliable used car.”
A pair of newer SUVs that debuted for the 2018 model year comprise the third and fourth position on the list: the Mitsubishi Eclipse Cross and the Volkswagen Atlas respectively. “The Mitsubishi Eclipse Cross is one of the most affordable SUVs in the compact class, while the Volkswagen Atlas midsize SUV is among the best SUVs for families thanks to its cargo space and safety ratings,” said Ly.
Rounding out the list is the sixth-ranked Chevrolet Spark subcompact car. “With a low starting price and a long list of standard features, the Chevrolet Spark is a good value for those looking for a small car,” said Ly. “Consumers looking for a used version can likely get a great deal on the already affordable vehicle.”
Used Car Prices: Slow-Selling Cars
“The vehicles with the greatest slowdown in sales cover a wide range of price points and car types, so there are potential deals for many types of consumers,” said Ly. The following are prices for the one-year-old, three-year-old, and five-year-old used versions of the vehicles with the greatest sales slowdown:| Top 15 Vehicles With Greatest Sales Slowdown: Used Car Prices | ||||
| Rank | Vehicle | 1-Year-Old Average Used Car Price | 3-Year-Old Average Used Car Price | 5-Year-Old Average Used Car Price |
| 1 | Tesla Model 3 | $45,361 | $41,911 | - |
| 2 | Toyota RAV4 Hybrid | $32,368 | $24,334 | - |
| 3 | Volkswagen Atlas | $31,077 | - | - |
| 4 | Mitsubishi Eclipse Cross | $17,450 | - | - |
| 5 | Tesla Model X | $88,114 | $70,162 | - |
| 6 | Chevrolet Spark | $11,962 | $10,214 | $7,692 |
| 7 | Toyota RAV4 | $24,390 | $20,171 | $16,399 |
| 8 | Toyota C-HR | $19,727 | - | - |
| 9 | Lexus GX 460 | $47,830 | $37,420 | $29,236 |
| 10 | Honda HR-V | $21,688 | $17,670 | - |
| 11 | Honda Pilot | $34,494 | $28,123 | $19,003 |
| 12 | Toyota Highlander | $30,269 | $28,467 | $22,561 |
| 13 | Honda Civic | $19,404 | $16,439 | $12,812 |
| 14 | Honda Odyssey | $33,573 | $25,809 | $18,974 |
| 15 | Honda CR-V | $26,571 | $22,558 | $16,752 |
Slow-Selling Cars by Price Point
To accommodate a broad range of budgets, iSeeCars examined the average used car prices of one- to nine-year-old vehicles on the list to determine which ones sell for under $10,000, $15,000, and $20,000.Vehicles Under $10,000
When examining the vehicles with the greatest sales slowdown, here are the cars under $10,000 that can be found:| Vehicles With Greatest Sales Slowdown Under $10,000 | ||
| 1 | 2012 Honda Civic | $9,120 |
| 2 | 2016 Chevrolet Spark | $9,048 |
Vehicles Under $15,000
iSeeCars determined which cars under $15,000 could be found on the list:| Vehicles With Greatest Sales Slowdown Under $15,000 | ||
| 1 | 2015 Honda Civic | $12,812 |
| 2 | 2014 Honda CR-V | $14,709 |
| 3 | 2012 Toyota Highlander | $14,700 |
| 4 | 2013 Honda Odyssey | $14,036 |
| 5 | 2012 Honda Pilot | $13,375 |
| 6 | 2013 Toyota RAV4 | $14,271 |
| 7 | 2019 Chevrolet Spark | $11,962 |
Vehicles Under $20,000
iSeeCars determined which cars under $20,000 could be found on the list:| Vehicles With Greatest Sales Slowdown Under $20,000 | ||
| 1 | 2019 Toyota CH-R | $19,727 |
| 2 | 2019 Honda Civic | $19,404 |
| 3 | 2016 Honda CR-V | $18,178 |
| 4 | 2019 Mitsubishi Eclipse Cross | |
| 5 | 2013 Toyota Highlander | $16,487 |
| 6 | 2018 Honda HR-V | $18,802 |
| 7 | 2015 Honda Odyssey | $18,974 |
| 8 | 2015 Honda Pilot | $19,003 |
| 9 | 2016 Toyota RAV4 | $18,313 |
Geographic Analysis
COVID-19 Used Car Sales Impact: Ranking of 20 Largest Metro Areas
iSeeCars analyzed the data geographically to determine the difference in percentages of cars sold within a month between February and March in the 20 most populous metropolitan areas.| COVID-19 Used Car Sales Slowdown: Ranking of 20 Largest Metros | ||||
| Population Rank | Metro Area | % Sold w/in 30 days Feb 2020 | % Sold w/in 30 days Mar 2020 | 2020 Feb – Mar % Sold diff |
| 1 | New York, NY | 49.9% | 33.3% | -16.6% |
| 2 | Seattle-Tacoma, WA | 55.0% | 39.6% | -15.4% |
| 3 | Philadelphia, PA | 52.7% | 39.3% | -13.5% |
| 4 | Denver, CO | 55.4% | 42.3% | -13.1% |
| 5 | Boston, MA-Manchester, NH | 51.4% | 38.8% | -12.6% |
| 6 | Orlando-Daytona Beach, FL | 66.2% | 53.6% | -12.6% |
| 7 | Miami-Ft. Lauderdale, FL | 62.4% | 50.6% | -11.8% |
| 8 | Los Angeles, CA | 56.7% | 46.6% | -10.1% |
| 9 | Dallas-Ft. Worth, TX | 61.4% | 51.6% | -9.8% |
| 10 | Detroit, MI | 54.1% | 44.5% | -9.6% |
| 11 | Minneapolis-St. Paul, MN | 50.4% | 41.8% | -8.6% |
| 12 | Tampa-St Petersburg (Sarasota), FL | 60.6% | 52.0% | -8.6% |
| 13 | Chicago, IL | 52.8% | 44.5% | -8.3% |
| 14 | Washington, DC (Hagerstown, MD) | 55.3% | 47.6% | -7.6% |
| 15 | Atlanta, GA | 61.4% | 54.0% | -7.4% |
| 16 | Cleveland-Akron (Canton), OH | 53.0% | 46.4% | -6.6% |
| 17 | Phoenix, AZ | 58.7% | 52.7% | -6.0% |
| 18 | Sacramento-Stockton-Modesto, CA | 66.6% | 61.9% | -4.7% |
| 19 | Houston, TX | 62.3% | 58.2% | -4.1% |
| 20 | San Francisco-Oakland-San Jose, CA | 67.9% | 64.2% | -3.8% |
COVID-19 Used Car Sales Impact: Ranking of 50 Largest Metro Areas
iSeeCars also analyzed the data to rank the slowdown in used car sales between February and March 2020 in the 50 most populous metro areas.| COVID-19 Used Car Sales Slowdown: Ranking of 50 Largest Metros | ||||
| Rank | Metro Area | % Sold w/in 30 days Feb 2020 | % Sold w/in 30 days Mar 2020 | 2020 Feb – Mar % Sold diff |
| 1 | Harrisburg-Lancaster-York, PA | 49.6% | 32.2% | -17.4% |
| 2 | New York, NY | 49.9% | 33.3% | -16.6% |
| 3 | Seattle-Tacoma, WA | 55.0% | 39.6% | -15.4% |
| 4 | St. Louis, MO | 50.8% | 36.4% | -14.4% |
| 5 | Philadelphia, PA | 52.7% | 39.3% | -13.5% |
| 6 | Denver, CO | 55.4% | 42.3% | -13.1% |
| 7 | Pittsburgh, PA | 57.1% | 44.1% | -13.0% |
| 8 | Fresno-Visalia, CA | 67.0% | 54.2% | -12.8% |
| 9 | Boston, MA-Manchester, NH | 51.4% | 38.8% | -12.6% |
| 10 | Orlando-Daytona Beach, FL | 66.2% | 53.6% | -12.6% |
| 11 | Grand Rapids-Kalamazoo, MI | 51.7% | 39.3% | -12.4% |
| 12 | San Antonio, TX | 58.4% | 46.1% | -12.3% |
| 13 | Cincinnati, OH | 50.6% | 38.6% | -12.0% |
| 14 | Miami-Ft. Lauderdale, FL | 62.4% | 50.6% | -11.8% |
| 15 | Oklahoma City, OK | 56.8% | 45.1% | -11.7% |
| 16 | San Diego, CA | 63.8% | 52.7% | -11.2% |
| 17 | Birmingham, AL | 53.4% | 42.3% | -11.1% |
| 18 | Austin, TX | 65.3% | 54.4% | -10.9% |
| 19 | Greensboro-Winston Salem, NC | 53.7% | 43.1% | -10.6% |
| 20 | Indianapolis, IN | 52.8% | 42.3% | -10.5% |
| 21 | Albuquerque-Santa Fe, NM | 58.7% | 48.2% | -10.5% |
| 22 | Los Angeles, CA | 56.7% | 46.6% | -10.1% |
| 23 | Portland, OR | 57.4% | 47.5% | -9.9% |
| 24 | Dallas-Ft. Worth, TX | 61.4% | 51.6% | -9.8% |
| Overall Average | -9.8% | |||
| 25 | Detroit, MI | 54.1% | 44.5% | -9.6% |
| 26 | Hartford & New Haven, CT | 51.1% | 41.8% | -9.3% |
| 27 | Minneapolis-St. Paul, MN | 50.4% | 41.8% | -8.6% |
| 28 | Tampa-St Petersburg (Sarasota), FL | 60.6% | 52.0% | -8.6% |
| 29 | Chicago, IL | 52.8% | 44.5% | -8.3% |
| 30 | West Palm Beach-Ft. Pierce, FL | 63.5% | 55.8% | -7.7% |
| 31 | Washington, DC (Hagerstown, MD) | 55.3% | 47.6% | -7.6% |
| 32 | Atlanta, GA | 61.4% | 54.0% | -7.4% |
| 33 | Jacksonville, FL | 59.1% | 51.8% | -7.4% |
| 34 | Greenville-Spartanburg, SC | 61.0% | 53.7% | -7.3% |
| 35 | Las Vegas, NV | 63.3% | 56.2% | -7.1% |
| 36 | Cleveland-Akron (Canton), OH | 53.0% | 46.4% | -6.6% |
| 37 | Salt Lake City, UT | 50.0% | 43.4% | -6.6% |
| 38 | Memphis, TN | 53.5% | 46.9% | -6.5% |
| 39 | Raleigh-Durham (Fayetteville), NC | 55.4% | 49.0% | -6.4% |
| 40 | Columbus, OH | 59.4% | 53.0% | -6.4% |
| 41 | Milwaukee, WI | 47.5% | 41.3% | -6.3% |
| 42 | Charlotte, NC | 63.9% | 57.9% | -6.1% |
| 43 | Phoenix, AZ | 58.7% | 52.7% | -6.0% |
| 44 | Nashville, TN | 61.5% | 56.0% | -5.5% |
| 45 | Baltimore, MD | 55.1% | 49.7% | -5.4% |
| 46 | Sacramento-Stockton-Modesto, CA | 66.6% | 61.9% | -4.7% |
| 47 | Kansas City, MO | 50.2% | 45.9% | -4.3% |
| 48 | Houston, TX | 62.3% | 58.2% | -4.1% |
| 49 | San Francisco-Oakland-San Jose, CA | 67.9% | 64.2% | -3.8% |
| 50 | Norfolk-Portsmouth-Newport News,VA | 54.1% | 52.1% | -2.0% |
COVID-19 Used Car Sales Impact by State
iSeeCars further analyzed the data to see the slowdown of used car sales by state.| COVID-19 Used Car Sales Slowdown: Ranking by State | ||||
| Rank | State | % Sold w/in 30 days Feb 2020 | % Sold w/in 30 days Mar 2020 | 2020 Feb – Mar % Sold diff |
| 1 | Pennsylvania | 50.6% | 35.0% | -15.6% |
| 2 | Massachusetts | 51.1% | 35.6% | -15.5% |
| 3 | New York | 51.0% | 36.0% | -15.0% |
| 4 | Washington | 55.5% | 40.6% | -14.9% |
| 5 | New Jersey | 50.4% | 35.9% | -14.5% |
| 6 | Hawaii | 58.0% | 43.7% | -14.3% |
| 7 | Wyoming | 51.6% | 37.5% | -14.1% |
| 8 | Rhode Island | 46.1% | 32.2% | -13.9% |
| 9 | Colorado | 54.4% | 41.4% | -13.0% |
| 10 | Kentucky | 52.2% | 39.5% | -12.7% |
| 11 | North Dakota | 52.3% | 40.0% | -12.3% |
| 12 | Michigan | 53.8% | 41.6% | -12.2% |
| 13 | Louisiana | 56.3% | 44.5% | -11.9% |
| 14 | Vermont | 56.4% | 44.9% | -11.6% |
| 15 | West Virginia | 52.1% | 40.5% | -11.5% |
| 16 | New Mexico | 59.0% | 48.3% | -10.7% |
| 17 | Indiana | 52.2% | 41.7% | -10.4% |
| 18 | Oklahoma | 56.4% | 46.4% | -10.0% |
| 19 | Florida | 62.9% | 53.2% | -9.8% |
| Overall Average | -9.8% | |||
| 20 | Connecticut | 49.9% | 40.2% | -9.6% |
| 21 | New Hampshire | 49.6% | 40.0% | -9.6% |
| 22 | South Dakota | 45.1% | 35.9% | -9.2% |
| 23 | Minnesota | 50.5% | 41.7% | -8.8% |
| 24 | South Carolina | 60.5% | 51.9% | -8.6% |
| 25 | Alabama | 54.9% | 46.3% | -8.6% |
| 26 | Oregon | 54.6% | 46.1% | -8.6% |
| 27 | Arkansas | 56.2% | 47.7% | -8.5% |
| 28 | Texas | 61.5% | 53.0% | -8.5% |
| 29 | California | 61.8% | 53.4% | -8.4% |
| 30 | Maine | 46.8% | 38.4% | -8.4% |
| 31 | Illinois | 50.2% | 41.8% | -8.4% |
| 32 | Montana | 49.2% | 40.9% | -8.3% |
| 33 | Virginia | 52.9% | 44.8% | -8.1% |
| 34 | Ohio | 54.5% | 46.7% | -7.8% |
| 35 | Tennessee | 58.5% | 50.9% | -7.6% |
| 36 | Iowa | 47.1% | 39.5% | -7.6% |
| 37 | Delaware | 68.0% | 60.4% | -7.6% |
| 38 | North Carolina | 59.0% | 51.6% | -7.4% |
| 39 | Nebraska | 51.2% | 43.8% | -7.4% |
| 40 | Georgia | 60.5% | 53.3% | -7.2% |
| 41 | Nevada | 61.7% | 54.6% | -7.1% |
| 42 | Utah | 50.2% | 43.2% | -7.0% |
| 43 | Kansas | 50.2% | 43.3% | -6.9% |
| 44 | Missouri | 52.3% | 45.4% | -6.9% |
| 45 | Alaska | 46.2% | 39.3% | -6.9% |
| 46 | Arizona | 58.2% | 52.3% | -5.9% |
| 47 | Wisconsin | 46.8% | 41.5% | -5.3% |
| 48 | Mississippi | 55.0% | 50.1% | -4.9% |
| 49 | Maryland | 58.6% | 54.9% | -3.7% |
| 50 | Idaho | 47.8% | 44.9% | -2.9% |
“Many dealers are taking special precautions such as conducting online transactions and contact-free services so consumers who want to can still safely purchase a car”, said Ly. “Used car shoppers should look at how long a vehicle has been on the lot because dealers will be more willing to discount slow-moving vehicles.”
Methodology
iSeeCars analyzed over 1.8 million used cars listed from February 1st to March 18th, 2020, tracking when these cars were sold. The percentage of each model that was sold within 30 days of being listed was calculated for cars listed in February vs. March, and the difference between these two percentages was used to rank the Top 15 Cars with the Greatest Slowdown in Sales. Models discontinued prior to the 2020 model year, heavy-duty vehicles, and low-volume models were excluded from further analysis. The average prices of used one- to nine-year-old versions of the Top 15 Cars with the Greatest Slowdown in Sales were also calculated.
About iSeeCars.com


