
Highlights:
- Over the past year used cars have become 5.8 percent more affordable as prices fell and median household income rose
- New and used electric vehicles are rapidly improving in affordability, with prices down 10 percent for new EVs and 20 percent for used EVs
- 23 Used car models have become affordable since October 2022, including the Chevrolet Blazer, Honda Pilot, and Tesla Model 3
- New cars became less affordable due to higher prices and higher interest rates increasing their monthly payments by 11.3 percent
- 6 New cars have become unaffordable since October of 2022, including the Ford Bronco, Hyundai Tucson Hybrid, and Toyota Prius Prime
- Consumers now need to take a 90-month loan to make the average new car affordable, but that loan term adds almost $14,000, or 28 percent, to the total cost of a car
After years of dramatic price increases, used car and electric vehicle affordability actually improved over the past 11 months. Despite a substantial increase in interest rates since October 2022, household income increased by 3.7 percent and used car prices fell by 5.4 percent. Electric vehicle prices dropped even more, with used EVs down nearly 20 percent and new EVs down by 10 percent. The result is improved overall used car and electric vehicle affordability.
Unfortunately, the same cannot be said for new cars, which have seen continued price hikes over the past 11 months. Combined with higher interest rates, these increases have made new cars less affordable over the past year, as measured by a 6.8 percentage drop in the iSeeCars Affordability Index for new cars.
“With the unprecedented rise in interest rates over the past year we didn’t expect vehicle affordability to improve for any segment,” said iSeeCars Executive Analyst Karl Brauer. “But used car prices have finally come off their highs and are starting to moderate after years of increasing. Electric vehicle prices have simply tumbled over the past year, improving affordability on both new and used models. This shift, plus the rise in median household income, has improved the situation for buyers and added 23 models to the used car affordability list compared to last October.”
iSeeCars analyzed new and used car affordability over time by calculating its Car Affordability Index, which compares median household income to an idealized income for financing a car. An index value of 100 suggests household income is exactly equal to the idealized income for a car purchase. Values above 100 indicate household income is above the idealized income and therefore cars are increasingly affordable; similarly, values below 100 suggest actual income is less than the idealized income, meaning cars are unaffordable. For example, an index value of 125 means household income is 25 percent more than the idealized income, and an index of 75 means household income is 25 percent less. The idealized income is based on typical car loan rates and terms for 60 months and 48 months for new and used car loans respectively, with down payments of 10 percent for new and 20 percent for used cars, and annual car payments no more than 10 percent of a household’s annual income.
Used car affordability
iSeeCars analyzed the affordability of 3-year-old used cars over the past 12 months. The iSeeCars Car Affordability Index was at 98.36 in October 2022, then peaked in December at 103 before falling below 99 in May 2023. But it’s been improving every month since May, reaching 104.03 in September 2023.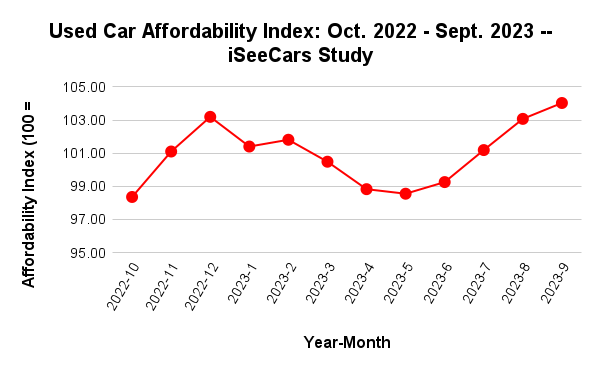 “A 3.7 percent increase in median household income, from $75,515 to $78,335 over the past year, coincided with a drop in average used car prices from $33,912 to $32,801,” said Brauer. “These factors were enough to overcome the bump in interest rates, making the average used car more affordable.”
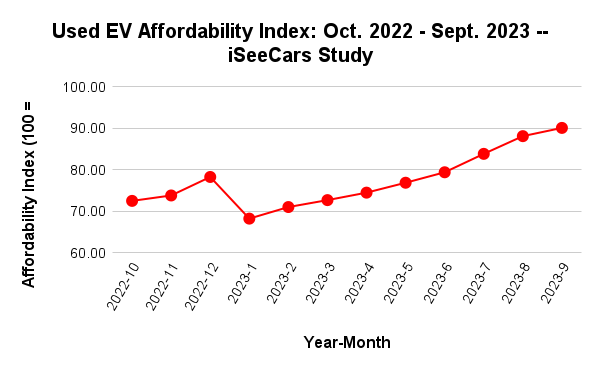
Used EV affordability
Used EV affordability made the biggest jump over the past year, with the iSeeCars Affordability Index rising from 72.48 to 90.10 since October 2022. Most of that shift comes from a 19.5 percent drop in the average used EV price, from $46,020 to $37,040. This translates to a 16.6 percent – or $144 – drop in monthly payments for used EVs.“While the average used EV remains beyond the reach of today’s used car buyer, they are much closer to being affordable than they were 11 months ago,” said Brauer. “Their lower prices are a reflection of falling new EV prices.”
21 More used cars are affordable this year
Using the interest rate and household income data from October 2022 and September 2023, iSeeCars calculated the 3-year-old used car price that would have an Affordability Index value of 100 in these two periods. Based on these affordability pricing thresholds, there were 137 affordable used cars priced below the threshold in October 2022, but by September 2023 that number increased to 158. There were actually two used cars that became unaffordable over the past year, the Mercedes-Benz CLA and the Ford Explorer, but these two were offset by 23 models that became affordable over the past 11 months, for a net gain of 21 more affordable cars in September 2023 compared to October 2022.“The list of newly affordable used cars includes a healthy mix of luxury and mainstream brands, with nearly every vehicle type represented,” said Brauer. “Family buyers seeking a three-row SUV, performance enthusiasts searching for a sporty coupe, and fans of hybrid or electric vehicles looking to cut fuel costs and CO2 emissions can all find a car on this list.”
| Used Cars That Have Become Affordable: Sept. 2023 vs. Oct. 2022 – iSeeCars Study | ||||
| Rank | Model | % Price Difference Below the Affordability Threshold | % Price Drop from Oct. 2022 | Average 3-Year-Old Used Car Price 2023 |
| 1 | BMW i3 | -16.9% | -18.1% | $27,748 |
| 2 | Chevrolet Blazer | -12.9% | -16.6% | $29,062 |
| 3 | Volvo S60 | -11.6% | -14.4% | $29,507 |
| 4 | Alfa Romeo Stelvio | -8.8% | -9.0% | $30,431 |
| 5 | Genesis G70 | -8.0% | -10.9% | $30,689 |
| 6 | BMW 2 Series | -6.8% | -15.8% | $31,116 |
| 7 | Volvo XC40 | -6.2% | -11.7% | $31,302 |
| 8 | Cadillac XT4 | -6.0% | -9.2% | $31,373 |
| 9 | Buick Enclave | -4.2% | -6.4% | $31,986 |
| 10 | Lexus IS 300 | -4.1% | -4.7% | $31,993 |
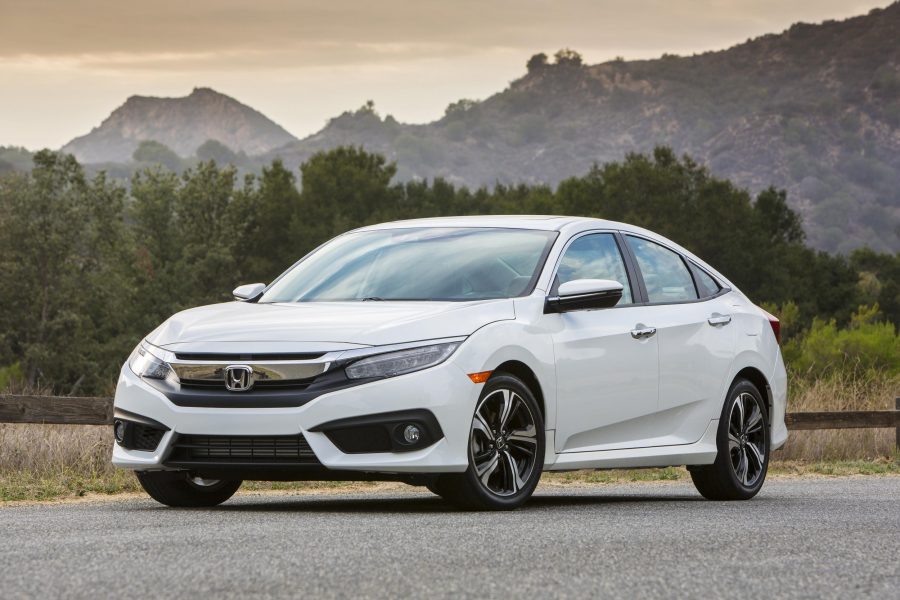
| 11 | Honda Pilot | -3.4% | -3.6% | $32,230 |
| 12 | Audi A5 Sportback | -3.4% | -12.3% | $32,230 |
| 13 | Nissan Armada | -3.3% | -10.8% | $32,268 |
| 14 | Jeep Grand Cherokee | -2.5% | -5.6% | $32,547 |
| 15 | Audi Q5 | -2.2% | -8.5% | $32,646 |
| 16 | Toyota Avalon | -1.9% | -3.1% | $32,748 |
| 17 | Kia Stinger | -1.7% | -8.8% | $32,811 |
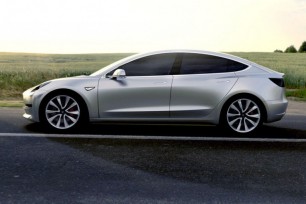
| 18 | Tesla Model 3 | -1.5% | -28.9% | $32,861 |
| 19 | Lexus UX 250h | -1.3% | -9.9% | $32,931 |
| 20 | BMW 3 Series | -1.0% | -6.0% | $33,036 |
| 21 | Ford Ranger | -0.9% | -4.0% | $33,080 |
| 22 | Jaguar E-PACE | -0.2% | -3.5% | $33,303 |
| 23 | Lexus NX 300 | -0.1% | -3.9% | $33,352 |
| National Sept. 2023 Affordable 3-Year-Old Used Car Price Threshold | $33,373 | |||
New car affordability
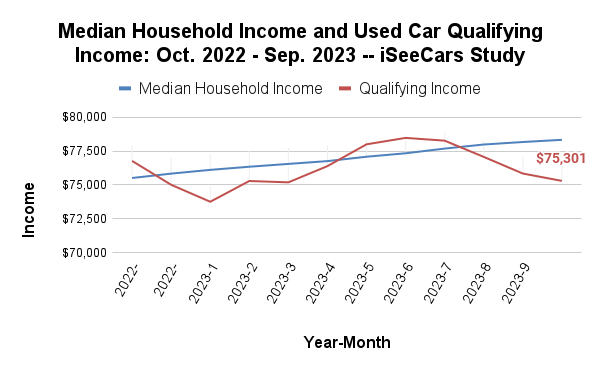
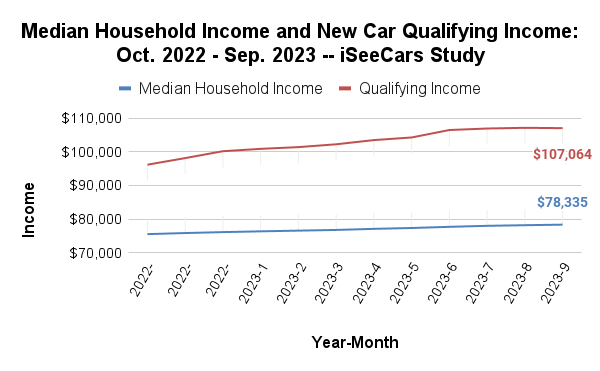
Using its Car Affordability Index, iSeeCars calculated the price threshold for affordable new cars and confirmed a 6.8 percent downward shift in affordability between October 2022 and September 2023, with the index moving from 78.51 to 73.17. Most of that drop occurred before June 2023, with new car affordability somewhat stabilizing in recent months but not improving to any meaningful degree. The drop coincides with an increase in monthly payments by 11.3 percent, from $802 to $892, or an extra $1,088 a year.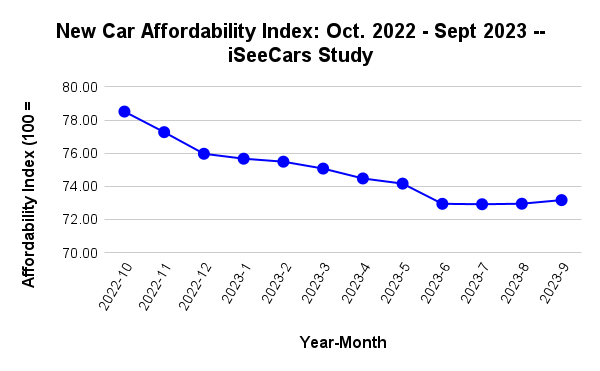 “With the average new car price rising from $46,551 to $49,499, plus the big interest rate hikes we’ve seen over the past year, new cars are less affordable for consumers today compared to last year,” said Brauer. “The same increase in median household income that made used cars more affordable was not enough to counter these factors, as the growing gap between qualifying household income and median household income confirms.”
New EV affordability
Electric vehicles have never represented an affordable option for new car buyers, but a drop in prices of more than 10 percent over the past year, from $64,092 to $57,412, has them moving in the right direction. In October of 2022 new EVs were at 57.02 on the iSeeCars New Car Affordability Index. In September of 2023 they were at 63.08. This translates to a $69 drop in monthly payments, 6.2 percent lower than last year.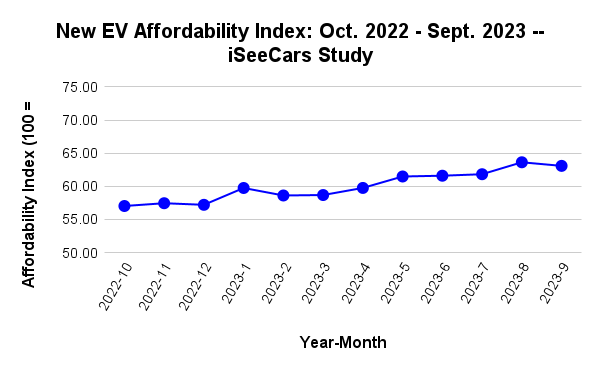
“New electric vehicles remain much more expensive than the average new car, but unlike the increasing cost of traditional new cars, average new EV prices have fallen as a direct result of Tesla’s price cuts,” said Brauer. “Tesla remains the dominant force in the electric car market, and when Tesla’s prices fall it’s reflected in overall EV pricing.”
Six new cars shift from affordable to unaffordable
This downward shift in new car affordability has pushed six models off the affordable new car list compared to October 2022. All of these cars are priced well below today’s average new car price, further illustrating how difficult it is for consumers trying to pay for a new vehicle.| New Cars That Are No Longer Affordable: Sept. 2023 vs. Oct. 2022 – iSeeCars Study | ||||
| Rank | Model | % Price Difference Above the Affordability Threshold | % Price Increase from Oct. 2022 | Average New Car Price 2023 |
| 1 | Toyota Prius Prime | 10.5% | 20.9% | $40,015 |
| 2 | Hyundai Tucson Hybrid | 8.1% | 7.3% | $39,163 |
| 3 | Volkswagen Golf GTI | 4.5% | 10.7% | $37,855 |
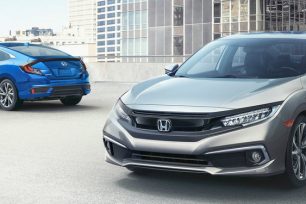
| 4 | Acura Integra | 3.0% | 3.7% | $37,302 |
| 5 | Ford Bronco Sport | 2.3% | 1.8% | $37,041 |
| 6 | MINI Hardtop 2 Door | 1.2% | 2.6% | $36,662 |
| National Sept. 2023 Affordable New Car Price Threshold | $36,217 | |||
How to afford a new car – Is a longer loan the answer?
The rising cost of new cars has forced many consumers into longer loans to keep their monthly payment affordable. While 5-year (60-month) car loans were the standard term for decades, 6-year (72-month) and 7-year (84-month) loans have become increasingly common.iSeeCars calculated how long of a loan term is needed to afford a new vehicle, assuming the same 10 percent down payment and an interest rate equal to the latest 60-month interest rate (unlikely to be the case in reality, as increasing loan duration tends to increase APRs).To keep the monthly payment below 10 percent of the average household income, a consumer would have to take out a 90-month (7.5-year) loan to afford the average price of a new car. That’s 10 months longer than the 80-month loan that would have been affordable in October of 2022.
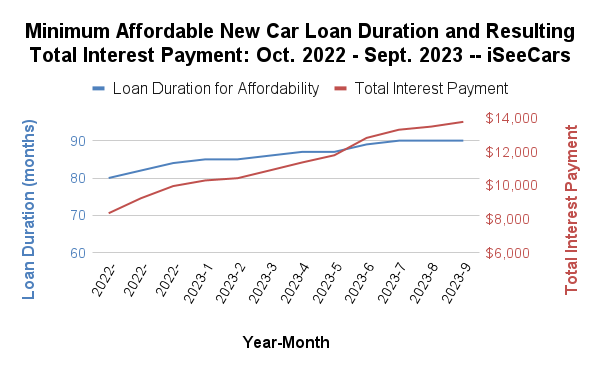
A longer loan does improve affordability, but it also increases the interest a consumer pays. In the case of a 90-month loan, the buyer would pay an additional $13,789 (27.9 percent) in interest over the original new car price, versus an additional $8,983 (18.1 percent) in interest over the car’s price for a 60-month loan.
“While a longer car loan seems like the easy path to affordability, it actually makes today’s already high-priced new and used cars even more expensive for the consumer,” said Brauer. “The extra expense may be shrouded in more affordable monthly payments, but the math doesn’t lie – and the much higher total cost of the vehicle reflects it.”
New and used car affordability by state
iSeeCars calculated its Affordability Index for each state to determine which ones had the largest changes in affordability for both new and used cars between October 2022 and September 2023.For new cars, all states saw a drop in affordability. South Dakota had the smallest drop, while Utah had the largest.
| New Car Affordability by State – iSeeCars Study | ||||
| Rank | State | Affordability Index October 2022 | Affordability Index September 2023 | % Change in Affordability |
| 1 | Utah | 103.86 | 82.60 | -20.5% |
| 2 | Alaska | 92.33 | 75.12 | -18.6% |
| 3 | Oregon | 85.70 | 70.97 | -17.2% |
| 4 | Massachusetts | 109.92 | 93.43 | -15.0% |
| 5 | Alabama | 69.36 | 59.07 | -14.8% |
| 6 | Connecticut | 106.36 | 91.73 | -13.8% |
| 7 | Washington | 105.85 | 91.92 | -13.2% |
| 8 | Kentucky | 66.30 | 58.94 | -11.1% |
| 9 | Maine | 73.15 | 65.13 | -11.0% |
| 10 | Idaho | 72.29 | 64.69 | -10.5% |
| 11 | Kansas | 72.64 | 65.41 | -10.0% |
| 12 | Nebraska | 71.07 | 64.11 | -9.8% |
| 13 | Pennsylvania | 81.03 | 73.42 | -9.4% |
| 14 | Montana | 69.29 | 62.90 | -9.2% |
| 15 | Rhode Island | 94.12 | 85.76 | -8.9% |
| 16 | Minnesota | 88.04 | 80.65 | -8.4% |
| 17 | Hawaii | 95.26 | 87.37 | -8.3% |
| 18 | Florida | 76.64 | 70.33 | -8.2% |
| 19 | Indiana | 72.19 | 66.29 | -8.2% |
| 20 | New Hampshire | 99.04 | 91.51 | -7.6% |
| 21 | Maryland | 104.17 | 96.30 | -7.6% |
| 22 | Arizona | 83.23 | 76.96 | -7.5% |
| 23 | Virginia | 93.26 | 86.37 | -7.4% |
| 24 | Illinois | 84.44 | 78.41 | -7.1% |
| 25 | North Carolina | 70.88 | 66.07 | -6.8% |
| 26 | Missouri | 68.34 | 63.84 | -6.6% |
| 27 | Vermont | 84.99 | 79.41 | -6.6% |
| 28 | Nevada | 70.90 | 66.27 | -6.5% |
| 29 | New York | 85.56 | 80.14 | -6.3% |
| 30 | South Carolina | 67.85 | 63.60 | -6.3% |
| 31 | North Dakota | 70.05 | 65.83 | -6.0% |
| 32 | Delaware | 82.92 | 77.93 | -6.0% |
| 33 | California | 93.12 | 87.73 | -5.8% |
| 34 | West Virginia | 58.82 | 55.58 | -5.5% |
| 35 | Colorado | 88.23 | 83.63 | -5.2% |
| 36 | Mississippi | 54.53 | 51.72 | -5.2% |
| 37 | Texas | 70.88 | 67.52 | -4.7% |
| 38 | Ohio | 72.06 | 68.69 | -4.7% |
| 39 | Wyoming | 62.59 | 59.71 | -4.6% |
| 40 | Oklahoma | 60.16 | 57.53 | -4.4% |
| 41 | New Jersey | 98.22 | 94.21 | -4.1% |
| 42 | Tennessee | 69.32 | 66.51 | -4.1% |
| 43 | Louisiana | 54.44 | 52.44 | -3.7% |
| 44 | Arkansas | 55.48 | 53.52 | -3.5% |
| 45 | Wisconsin | 71.55 | 69.05 | -3.5% |
| 46 | Michigan | 69.48 | 67.31 | -3.1% |
| 47 | Georgia | 73.96 | 71.70 | -3.1% |
| 48 | Iowa | 66.95 | 65.57 | -2.1% |
| 49 | New Mexico | 56.83 | 56.66 | -0.3% |
| 50 | South Dakota | 64.81 | 64.73 | -0.1% |
| Used Car Affordability by State – iSeeCars Study | ||||
| Rank | State | Affordability Index October 2022 | Affordability Index September 2023 | % Change in Affordability |
| 1 | Hawaii | 120.13 | 166.79 | 38.8% |
| 2 | Washington | 107.93 | 128.50 | 19.1% |
| 3 | Oregon | 89.90 | 106.34 | 18.3% |
| 4 | Delaware | 95.41 | 111.27 | 16.6% |
| 5 | Wisconsin | 91.27 | 99.82 | 9.4% |
| 6 | Virginia | 113.48 | 123.89 | 9.2% |
| 7 | Illinois | 96.98 | 105.18 | 8.5% |
| 8 | Arizona | 93.62 | 101.45 | 8.4% |
| 9 | Louisiana | 71.12 | 76.89 | 8.1% |
| 10 | Mississippi | 68.47 | 73.95 | 8.0% |
| 11 | New Mexico | 75.76 | 81.69 | 7.8% |
| 12 | Wyoming | 73.62 | 79.31 | 7.7% |
| 13 | California | 118.05 | 127.07 | 7.6% |
| 14 | Florida | 91.88 | 98.65 | 7.4% |
| 15 | Nevada | 93.91 | 100.62 | 7.2% |
| 16 | Missouri | 85.72 | 91.63 | 6.9% |
| 17 | Oklahoma | 79.39 | 84.77 | 6.8% |
| 18 | Colorado | 109.50 | 116.54 | 6.4% |
| 19 | Georgia | 92.11 | 97.97 | 6.4% |
| 20 | Kansas | 86.77 | 92.16 | 6.2% |
| 21 | Alabama | 78.72 | 83.57 | 6.2% |
| 22 | New York | 112.12 | 118.74 | 5.9% |
| 23 | Maryland | 130.26 | 137.95 | 5.9% |
| 24 | Pennsylvania | 99.13 | 104.88 | 5.8% |
| 25 | Indiana | 92.14 | 97.37 | 5.7% |
| 26 | Alaska | 110.04 | 116.25 | 5.6% |
| 27 | Texas | 92.20 | 97.14 | 5.4% |
| 28 | Michigan | 96.09 | 101.14 | 5.3% |
| 29 | Ohio | 94.29 | 99.13 | 5.1% |
| 30 | West Virginia | 72.63 | 76.29 | 5.0% |
| 31 | North Carolina | 87.66 | 92.00 | 4.9% |
| 32 | New Hampshire | 121.03 | 126.66 | 4.7% |
| 33 | South Dakota | 84.79 | 88.52 | 4.4% |
| 34 | Iowa | 90.58 | 94.33 | 4.1% |
| 35 | South Carolina | 85.23 | 88.50 | 3.8% |
| 36 | Maine | 90.71 | 94.10 | 3.7% |
| 37 | New Jersey | 132.47 | 137.35 | 3.7% |
| 38 | Vermont | 102.69 | 106.34 | 3.6% |
| 39 | Massachusetts | 127.63 | 131.56 | 3.1% |
| 40 | Tennessee | 86.86 | 89.42 | 3.0% |
| 41 | Rhode Island | 112.21 | 115.35 | 2.8% |
| 42 | Utah | 117.03 | 119.96 | 2.5% |
| 43 | Kentucky | 81.59 | 83.54 | 2.4% |
| 44 | North Dakota | 87.91 | 89.30 | 1.6% |
| 45 | Idaho | 88.76 | 90.11 | 1.5% |
| 46 | Arkansas | 73.09 | 73.79 | 1.0% |
| 47 | Minnesota | 108.94 | 109.90 | 0.9% |
| 48 | Connecticut | 122.67 | 123.65 | 0.8% |
| 49 | Nebraska | 91.18 | 91.00 | -0.2% |
| 50 | Montana | 82.29 | 80.93 | -1.7% |
New and used car affordability by metro area
iSeeCars also calculated its Affordability Index for each of the top 50 most populous metro areas to determine which ones had the largest changes in affordability for both new and used cars between October 2022 and September 2023.Remarkably, six of the 50 largest metro areas bucked the national trend and saw an improvement in new car affordability. Among those that saw an drop in new car affordability, Salt Lake City had the largest drop.
| New Car Affordability by Metro Area – iSeeCars Study | ||||
| Rank | Metro Area | Affordability Index October 2022 | Affordability Index September 2023 | % Change in Affordability |
| 1 | Salt Lake City, UT | 118.36 | 83.36 | -29.6% |
| 2 | Portland-Vancouver-Hillsboro, OR-WA | 99.76 | 80.69 | -19.1% |
| 3 | Hartford-East Hartford-Middletown, CT | 113.39 | 93.49 | -17.5% |
| 4 | Seattle-Tacoma-Bellevue, WA | 128.66 | 106.38 | -17.3% |
| 5 | Pittsburgh, PA | 88.15 | 73.55 | -16.6% |
| 6 | San Jose-Sunnyvale-Santa Clara, CA | 173.32 | 145.53 | -16.0% |
| 7 | Boston-Cambridge-Newton, MA-NH | 118.09 | 99.85 | -15.4% |
| 8 | Tampa-St. Petersburg-Clearwater, FL | 83.43 | 70.67 | -15.3% |
| 9 | San Antonio-New Braunfels, TX | 75.11 | 64.82 | -13.7% |
| 10 | Cincinnati, OH-KY-IN | 90.43 | 79.59 | -12.0% |
| 11 | Richmond, VA | 89.49 | 79.08 | -11.6% |
| 12 | Providence-Warwick, RI-MA | 98.79 | 87.48 | -11.4% |
| 13 | Kansas City, MO-KS | 80.08 | 72.51 | -9.4% |
| 14 | Chicago-Naperville-Elgin, IL-IN-WI | 94.85 | 86.22 | -9.1% |
| 15 | Raleigh-Cary, NC | 91.46 | 83.26 | -9.0% |
| 16 | Washington-Arlington-Alexandria, DC-VA-MD-WV | 127.60 | 116.43 | -8.8% |
| 17 | Riverside-San Bernardino-Ontario, CA | 90.96 | 83.10 | -8.6% |
| 18 | Minneapolis-St. Paul-Bloomington, MN-WI | 99.36 | 90.82 | -8.6% |
| 19 | Jacksonville, FL | 82.36 | 75.58 | -8.2% |
| 20 | Charlotte-Concord-Gastonia, NC-SC | 82.96 | 76.23 | -8.1% |
| 21 | Cleveland-Elyria, OH | 76.15 | 70.06 | -8.0% |
| 22 | Orlando-Kissimmee-Sanford, FL | 80.33 | 73.92 | -8.0% |
| 23 | San Francisco-Oakland-Berkeley, CA | 121.23 | 111.70 | -7.9% |
| 24 | Austin-Round Rock-Georgetown, TX | 98.04 | 90.38 | -7.8% |
| 25 | Phoenix-Mesa-Chandler, AZ | 90.50 | 83.60 | -7.6% |
| 26 | Indianapolis-Carmel-Anderson, IN | 85.14 | 78.84 | -7.4% |
| 27 | Dallas-Fort Worth-Arlington, TX | 81.15 | 76.13 | -6.2% |
| 28 | Baltimore-Columbia-Towson, MD | 98.41 | 92.37 | -6.1% |
| 29 | Las Vegas-Henderson-Paradise, NV | 69.83 | 65.57 | -6.1% |
| 30 | New York-Newark-Jersey City, NY-NJ-PA | 93.73 | 88.39 | -5.7% |
| 31 | Philadelphia-Camden-Wilmington, PA-NJ-DE-MD | 88.99 | 83.93 | -5.7% |
| 32 | Buffalo-Cheektowaga, NY | 77.92 | 73.68 | -5.4% |
| 33 | Miami-Fort Lauderdale-Pompano Beach, FL | 76.42 | 72.36 | -5.3% |
| 34 | Sacramento-Roseville-Folsom, CA | 82.84 | 78.48 | -5.3% |
| 35 | St. Louis, MO-IL | 75.98 | 72.51 | -4.6% |
| 36 | Memphis, TN-MS-AR | 67.86 | 64.95 | -4.3% |
| 37 | Columbus, OH | 84.99 | 81.50 | -4.1% |
| 38 | Denver-Aurora-Lakewood, CO | 97.18 | 93.33 | -4.0% |
| 39 | Birmingham-Hoover, AL | 67.59 | 65.11 | -3.7% |
| 40 | Houston-The Woodlands-Sugar Land, TX | 71.40 | 69.03 | -3.3% |
| 41 | Los Angeles-Long Beach-Anaheim, CA | 86.29 | 83.86 | -2.8% |
| 42 | Milwaukee-Waukesha, WI | 74.30 | 72.70 | -2.2% |
| 43 | Atlanta-Sandy Springs-Alpharetta, GA | 85.66 | 84.28 | -1.6% |
| 44 | Detroit-Warren-Dearborn, MI | 72.32 | 72.20 | -0.2% |
| 45 | Virginia Beach-Norfolk-Newport News, VA-NC | 76.10 | 77.21 | 1.5% |
| 46 | Nashville-Davidson--Murfreesboro--Franklin, TN | 77.60 | 79.10 | 1.9% |
| 47 | Oklahoma City, OK | 67.71 | 70.08 | 3.5% |
| 48 | New Orleans-Metairie, LA | 55.44 | 59.49 | 7.3% |
| 49 | Louisville/Jefferson County, KY-IN | 63.95 | 68.70 | 7.4% |
| 50 | San Diego-Chula Vista-Carlsbad, CA | 92.76 | 99.90 | 7.7% |
All 50 of the largest metro areas saw an improvement in used car affordability, led by the Seattle-Tacoma-Bellevue area in Washington state.
| Used Car Affordability by Metro Area – iSeeCars Study | ||||
| Rank | Metro Area | Affordability Index October 2022 | Affordability Index September 2023 | % Change in Affordability |
| 1 | Seattle-Tacoma-Bellevue, WA | 120.34 | 154.57 | 28.4% |
| 2 | Portland-Vancouver-Hillsboro, OR-WA | 104.94 | 126.51 | 20.6% |
| 3 | Milwaukee-Waukesha, WI | 91.25 | 103.17 | 13.1% |
| 4 | Richmond, VA | 106.43 | 119.42 | 12.2% |
| 5 | Orlando-Kissimmee-Sanford, FL | 97.55 | 109.24 | 12.0% |
| 6 | Sacramento-Roseville-Folsom, CA | 111.82 | 125.16 | 11.9% |
| 7 | San Antonio-New Braunfels, TX | 84.87 | 93.76 | 10.5% |
| 8 | Denver-Aurora-Lakewood, CO | 117.96 | 130.16 | 10.3% |
| 9 | Phoenix-Mesa-Chandler, AZ | 101.54 | 111.46 | 9.8% |
| 10 | Columbus, OH | 103.20 | 112.87 | 9.4% |
| 11 | Los Angeles-Long Beach-Anaheim, CA | 110.17 | 120.44 | 9.3% |
| 12 | Kansas City, MO-KS | 99.27 | 108.48 | 9.3% |
| 13 | Washington-Arlington-Alexandria, DC-VA-MD-WV | 153.05 | 166.50 | 8.8% |
| 14 | San Diego-Chula Vista-Carlsbad, CA | 128.09 | 139.08 | 8.6% |
| 15 | Nashville-Davidson--Murfreesboro--Franklin, TN | 100.89 | 109.47 | 8.5% |
| 16 | San Francisco-Oakland-Berkeley, CA | 158.14 | 171.55 | 8.5% |
| 17 | Chicago-Naperville-Elgin, IL-IN-WI | 106.03 | 114.96 | 8.4% |
| 18 | New Orleans-Metairie, LA | 81.99 | 88.66 | 8.1% |
| 19 | St. Louis, MO-IL | 95.70 | 103.36 | 8.0% |
| 20 | Raleigh-Cary, NC | 117.23 | 125.96 | 7.4% |
| 21 | Indianapolis-Carmel-Anderson, IN | 101.02 | 108.39 | 7.3% |
| 22 | Tampa-St. Petersburg-Clearwater, FL | 94.98 | 101.74 | 7.1% |
| 23 | Louisville/Jefferson County, KY-IN | 91.54 | 98.03 | 7.1% |
| 24 | Birmingham-Hoover, AL | 86.70 | 92.57 | 6.8% |
| 25 | Atlanta-Sandy Springs-Alpharetta, GA | 106.01 | 112.96 | 6.6% |
| 26 | Philadelphia-Camden-Wilmington, PA-NJ-DE-MD | 114.47 | 121.69 | 6.3% |
| 27 | Austin-Round Rock-Georgetown, TX | 115.37 | 122.60 | 6.3% |
| 28 | Pittsburgh, PA | 98.50 | 104.65 | 6.2% |
| 29 | Hartford-East Hartford-Middletown, CT | 116.98 | 124.18 | 6.2% |
| 30 | Detroit-Warren-Dearborn, MI | 103.71 | 110.04 | 6.1% |
| 31 | Las Vegas-Henderson-Paradise, NV | 94.05 | 99.76 | 6.1% |
| 32 | Salt Lake City, UT | 118.05 | 124.72 | 5.7% |
| 33 | Miami-Fort Lauderdale-Pompano Beach, FL | 92.12 | 97.32 | 5.6% |
| 34 | Riverside-San Bernardino-Ontario, CA | 112.06 | 117.53 | 4.9% |
| 35 | Baltimore-Columbia-Towson, MD | 125.55 | 131.49 | 4.7% |
| 36 | Charlotte-Concord-Gastonia, NC-SC | 98.41 | 103.02 | 4.7% |
| 37 | New York-Newark-Jersey City, NY-NJ-PA | 126.77 | 132.70 | 4.7% |
| 38 | Houston-The Woodlands-Sugar Land, TX | 97.06 | 101.52 | 4.6% |
| 39 | Cleveland-Elyria, OH | 95.81 | 100.11 | 4.5% |
| 40 | Boston-Cambridge-Newton, MA-NH | 137.15 | 143.19 | 4.4% |
| 41 | Dallas-Fort Worth-Arlington, TX | 107.16 | 111.64 | 4.2% |
| 42 | Virginia Beach-Norfolk-Newport News, VA-NC | 104.80 | 109.09 | 4.1% |
| 43 | Cincinnati, OH-KY-IN | 107.58 | 111.91 | 4.0% |
| 44 | Providence-Warwick, RI-MA | 114.25 | 118.65 | 3.9% |
| 45 | Jacksonville, FL | 108.80 | 112.79 | 3.7% |
| 46 | Buffalo-Cheektowaga, NY | 103.09 | 106.54 | 3.3% |
| 47 | Memphis, TN-MS-AR | 86.53 | 89.06 | 2.9% |
| 48 | Oklahoma City, OK | 91.58 | 93.28 | 1.9% |
| 49 | San Jose-Sunnyvale-Santa Clara, CA | 200.91 | 203.20 | 1.1% |
| 50 | Minneapolis-St. Paul-Bloomington, MN-WI | 122.99 | 123.06 | 0.1% |
Methodology
iSeeCars calculated its Car Affordability Index for new and used cars and EVs monthly from October 2022 to September 2023. The Car Affordability Index was calculated as the ratio between median household income (obtained from the U.S. Census Bureau’s American Community Survey (ACS) 1-year estimates and projected using the U.S. Bureau of Labor Statistics’ Earnings reports) and an idealized income for car payments, based on new cars’ and 3-year-old used cars’ pricing. An index of 100 means the idealized income for car payments exactly matches household income; values above 100 mean household income is greater than the idealized income for car payments, while values below 100 mean household income is less than the idealized income. Car payments were estimated using Bankrate.com’s published auto loan interest rates and loan terms, and the idealized household income was estimated assuming annual car payments should be no more than 10 percent of a household’s annual income. Average new EV prices were estimated using iSeeCars’ data and public reporting of Tesla’s price cuts from 2022 - 2023. The iSeeCars Car Affordability Index was calculated for new and 3-year-old used cars both nationally, by state, and by the Census Bureau’s Metropolitan Statistical Areas (MSAs).
About iSeeCars.com