
Used car prices are up 10.9 percent over last year as the microchip shortage continues to impact the automotive industry, according to iSeeCars.com’s latest analysis of over 1.8 million used car sales in July. This is slightly up from a 10.5 percent increase in June and marks the second month of slight increases after four months of slowing price growth.
Used Car Price Increases by State
Are used car price increases consistent across the country? Here are the average used car price increases by state in ascending order:| Used Car Price Increases by State: July 2022- iSeeCars | |||
| Rank | State | Year-Over-Year % Price Change | Year-Over-Year $ Price Change |
| 1 | Oklahoma | 0.8% | $278 |
| 2 | Alaska | 1.3% | $542 |
| 3 | Rhode Island | 3.4% | $1,038 |
| 4 | Hawaii | 5.0% | $1,562 |
| 5 | Mississippi | 5.1% | $1,663 |
| 6 | New Mexico | 5.5% | $1,788 |
| 7 | Arkansas | 5.6% | $1,906 |
| 8 | West Virginia | 5.8% | $1,885 |
| 9 | Missouri | 5.9% | $1,891 |
| 10 | South Dakota | 6.0% | $2,160 |
| 11 | Texas | 6.1% | $1,989 |
| 12 | Oregon | 6.2% | $2,027 |
| 13 | Idaho | 7.1% | $2,477 |
| 14 | Alabama | 7.2% | $2,218 |
| 15 | Louisiana | 7.4% | $2,355 |
| 16 | Michigan | 7.5% | $2,277 |
| 17 | Kansas | 7.7% | $2,442 |
| 18 | Utah | 7.9% | $2,431 |
| 19 | Indiana | 8.2% | $2,469 |
| 20 | Wyoming | 8.4% | $3,292 |
| 21 | Wisconsin | 8.4% | $2,638 |
| 22 | Tennessee | 8.6% | $2,663 |
| 23 | Nevada | 8.9% | $2,677 |
| 24 | Kentucky | 9.2% | $2,811 |
| 25 | Washington | 9.5% | $3,085 |
| 26 | Ohio | 9.6% | $2,775 |
| 27 | Virginia | 9.8% | $2,994 |
| 28 | Minnesota | 9.8% | $3,102 |
| 29 | Iowa | 9.9% | $3,153 |
| 30 | North Carolina | 10.0% | $3,106 |
| 31 | Montana | 10.2% | $3,836 |
| 32 | Nebraska | 10.3% | $3,240 |
| 33 | Georgia | 10.3% | $3,300 |
| 34 | Illinois | 10.5% | $3,297 |
| National Average | 10.9% | $34,291 | |
| 35 | Maine | 10.9% | $3,302 |
| 36 | Colorado | 11.1% | $3,475 |
| 37 | Vermont | 11.3% | $3,262 |
| 38 | New Hampshire | 11.4% | $3,386 |
| 39 | Delaware | 11.7% | $3,327 |
| 40 | Maryland | 11.7% | $3,470 |
| 41 | Pennsylvania | 12.6% | $3,708 |
| 42 | Florida | 13.0% | $3,842 |
| 43 | California | 13.1% | $4,004 |
| 44 | North Dakota | 13.4% | $4,411 |
| 45 | Arizona | 13.4% | $4,056 |
| 46 | Massachusetts | 14.1% | $4,176 |
| 47 | Connecticut | 14.3% | $4,138 |
| 48 | New Jersey | 15.2% | $4,486 |
| 49 | New York | 15.8% | $4,595 |
| 50 | South Carolina | 16.8% | $5,277 |
- South Carolina is the state with the greatest used car price increase in July 2022 compared to July 2021 at 16.8 percent, which amounts to $5,277
- Oklahoma has the smallest used car price increase at 0.8 percent, which amounts to $278.
- Of the 10 states with the highest price increases, seven are Eastern coastal states.
Vehicles with the Highest Used Car Price Increases by State
iSeeCars also examined which used car has gone up the most in price in each state:| Vehicles with the Highest Used Car Price Increases by State: July 2022- iSeeCars | ||||
| Rank | State | Year-Over-Year % Price Change | Year-Over-Year $ Price Change | |
| 1 | Alabama | Toyota Prius | 45.1% | $9,973 |
| 2 | Alaska | Nissan Rogue | 15.2% | $4,275 |
| 3 | Arizona | Hyundai Sonata Hybrid | 49.9% | $9,477 |
| 4 | Arkansas | Toyota Prius | 43.2% | $9,163 |
| 5 | California | Nissan LEAF | 53.5% | $9,778 |
| 6 | Colorado | Nissan LEAF | 74.5% | $13,146 |
| 7 | Connecticut | Audi Q3 | 39.9% | $10,192 |
| 8 | Delaware | Mercedes-Benz GLE | 30.1% | $14,332 |
| 9 | Florida | Hyundai Sonata Hybrid | 72.0% | $12,512 |
| 10 | Georgia | Audi A7 | 40.8% | $15,934 |
| 11 | Hawaii | Nissan Sentra | 24.8% | $4,342 |
| 12 | Idaho | Volkswagen Jetta | 22.2% | $4,107 |
| 13 | Illinois | Chevrolet Bolt EV | 41.3% | $9,317 |
| 14 | Indiana | Toyota Prius | 38.9% | $8,240 |
| 15 | Iowa | Mitsubishi Outlander | 30.8% | $5,482 |
| 16 | Kansas | Acura TLX | 28.1% | $9,174 |
| 17 | Kentucky | Mitsubishi Mirage G4 | 31.1% | $3,886 |
| 18 | Louisiana | Lincoln Navigator | 34.7% | $17,889 |
| 19 | Maine | Honda Accord | 26.1% | $5,815 |
| 20 | Maryland | Chevrolet Corvette | 55.2% | $39,866 |
| 21 | Massachusetts | Nissan LEAF | 73.9% | $15,093 |
| 22 | Michigan | Porsche Cayenne | 49.7% | $26,989 |
| 23 | Minnesota | Toyota Prius | 51.2% | $10,735 |
| 24 | Mississippi | BMW X5 | 29.6% | $12,552 |
| 25 | Missouri | Toyota Camry Hybrid | 38.2% | $9,659 |
| 26 | Montana | Honda Civic | 20.8% | $4,473 |
| 27 | Nebraska | Subaru Legacy | 38.9% | $7,003 |
| 28 | Nevada | Toyota Camry Hybrid | 39.2% | $9,788 |
| 29 | New Hampshire | Volvo S60 | 28.7% | $7,549 |
| 30 | New Jersey | Nissan LEAF | 55.4% | $10,017 |
| 31 | New Mexico | Kia Rio | 42.6% | $5,947 |
| 32 | New York | Hyundai Sonata Hybrid | 66.9% | $12,436 |
| 33 | North Carolina | Hyundai Sonata Hybrid | 67.7% | $12,846 |
| 34 | North Dakota | Honda Accord | 38.3% | $8,600 |
| 35 | Ohio | Toyota Avalon Hybrid | 37.0% | $9,737 |
| 36 | Oklahoma | Lincoln Navigator L | 36.0% | $21,167 |
| 37 | Oregon | Nissan LEAF | 68.2% | $13,905 |
| 38 | Pennsylvania | Nissan LEAF | 75.7% | $15,904 |
| 39 | Rhode Island | Volkswagen Jetta | 22.6% | $4,274 |
| 40 | South Carolina | Porsche Cayenne | 39.2% | $23,322 |
| 41 | South Dakota | Hyundai Elantra | 19.1% | $3,223 |
| 42 | Tennessee | Toyota Avalon Hybrid | 43.4% | $12,493 |
| 43 | Texas | Toyota Prius | 40.2% | $8,638 |
| 44 | Utah | Toyota Camry Hybrid | 44.7% | $10,775 |
| 45 | Vermont | Toyota RAV4 Hybrid | 23.0% | $7,038 |
| 46 | Virginia | Hyundai Sonata Hybrid | 61.3% | $10,951 |
| 47 | Washington | FIAT 500X | 71.1% | $10,742 |
| 48 | West Virginia | Mercedes-Benz GLE | 41.5% | $16,969 |
| 49 | Wisconsin | Toyota Camry Hybrid | 35.8% | $8,635 |
| 50 | Wyoming | Nissan Sentra | 16.8% | $3,016 |
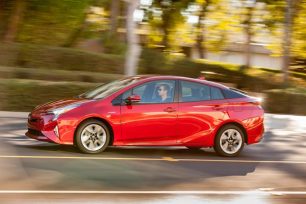
- The used car that has the highest increase in the most states is the Nissan LEAF in six states.
- The used car that has the highest increase across all states is the Nissan LEAF in Pennsylvania with a 75.7 percent increase.
More from iSeeCars.com:
MethodologyiSeeCars.com analyzed over 1.8 million 1-5-year-old used car sales in July 2021 and 2022. The average listing prices of each car model were compared between the two time periods, and the differences were expressed as both a percentage difference from the 2021 price as well as a dollar difference. Heavy-duty vehicles, low-volume vehicles, vehicles discontinued as of the 2022 model year, and vehicles with fewer than 4 of the 5 model years for each period were excluded from further analysis.
About iSeeCars.com