Highlights:
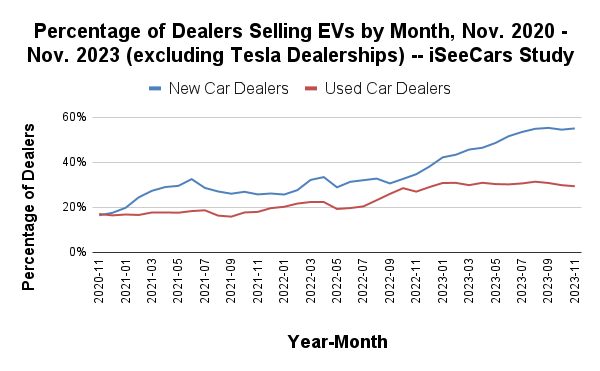
- Non-Tesla new car dealers selling electric vehicles in the U.S. increased from 16.5 percent to 55.1 percent between November 2020 and November 2023
- Non-Tesla electric vehicle market share has grown by more than 800 percent in the past three years
- Three small states, Delaware, Rhode Island, and Hawaii, have the highest percentage of new car dealers selling EVs, while larger, rural states like Montana, Wyoming, and Mississippi have the lowest percentage of new EV dealers
- The western states of California, Washington, and Utah have the highest percentage of used dealers selling EVs, while central states like Wyoming, Mississippi, and North Dakota have the lowest percentage of used EV dealers
- Larger dealers are far more likely to support EV sales because of the investment they require in training and on-site charging, which is likely keeping many medium and smaller car dealers from participating
The number of traditional, non-Tesla new car dealers selling electric vehicles has more than tripled in the past three years. Between November 2020 and November 2023, the percentage of dealers selling new EVs grew from 16.5 percent to 55.1 percent. Used car dealers offering EVs haven’t seen as much growth, but their numbers also rose dramatically, increasing from 17.1 percent to 29.4 percent in the same 3-year period.
iSeeCars analyzed the inventories of over 82,000 new and used car dealers from November 2020 to November 2023. The percentage of dealers who offered at least one EV for sale in each month was tallied both nationally and by state and metro area.
New and used car dealers joining the EV transition
Three years ago most car brands didn’t offer an electric vehicle, which limited the number of new dealers competing with Tesla. But as more traditional automakers produced new EVs the number of new EV dealers grew, particularly between 2022 and 2023. This increase in brands offering new EVs is now migrating to the used market, which should see a similar jump in used EV dealer participation over the next 2 to 3 years.“New car dealers – outside the Tesla network – offering electric vehicles have ramped up over the past three years, with the biggest growth occurring in just the past 12 months,” said Karl Brauer, iSeeCars executive analyst. “This is going to put increasing pressure on Tesla’s sales and market share. Used car dealers have also stepped into the EV market, with more than 70 percent growth compared to three years ago.”
| Percentage of Dealers Selling EVs* – iSeeCars Study | ||
| Month | Percentage of New Car Dealers | Percentage of Used Car Dealers |
| Nov. 2020 | 16.5% | 17.1% |
| Nov. 2021 | 25.8% | 18.0% |
| Nov. 2022 | 34.7% | 27.0% |
| Nov. 2023 | 55.1% | 29.4% |
Despite the recent growth in new car dealers selling electric vehicles, nearly half (44.9 percent) still don’t. Part of this is driven by automotive brands that don’t yet offer an EV, making it impossible for their dealers to sell them.
When looking only at brands that have at least one electric model, 73.5 percent of new car dealers offer them, which is a higher percentage but not yet 100%, suggesting there are other factors for dealers’ reticence to carry EVs for sale. On the used car side, over 70 percent of dealers still didn’t sell used EVs in November of 2023.
“Our analysis of market data has shown EV’s sales lagging in recent months,” said Brauer. “Current market conditions, including higher interest rates and general economic concerns, are dampening demand for electric cars, which could be causing some dealers to avoid retailing them.”
Most large dealers are selling EVs, most small dealers are not
The inventory size of a dealer has a clear relationship with the likelihood of a dealer carrying an EV. Though smaller dreams have rapidly increased their EV participation over the past three years, they still lag far behind larger dealerships.| Percentage of New Car Dealers Selling EVs, by Dealership Size* – iSeeCars Study | ||
| Monthly Number of New Cars for Sale | November 2023 | November 2020 |
| 10 - 50 | 34.1% | 5.2% |
| 51 - 100 | 54.6% | 11.3% |
| 101 - 500 | 67.4% | 19.5% |
| 501 - 1000 | 73.9% | 21.8% |
| 1001+ | 87.2% | 35.2% |
| Percentage of Used Car Dealers Selling EVs, by Dealership Size* – iSeeCars Study | ||
| Monthly Number of Used Cars for Sale | November 2023 | November 2020 |
| 10 - 50 | 9.6% | 5.7% |
| 51 - 100 | 26.7% | 12.4% |
| 101 - 500 | 53.9% | 25.6% |
| 501 - 1000 | 89.3% | 56.7% |
| 1001+ | 96.2% | 76.5% |
“Selling new or used electric vehicles requires a dealer to commit to understanding them, training their sales and service staff on them, and investing in on-site charging to keep EVs charged and ready for customers,” said Brauer. “It’s clearly a financial commitment smaller dealers aren’t yet willing to make, especially in a market where EV sales aren’t growing as fast as they were a year ago.”
Non-Tesla EV market share explodes
EV market share for non-Tesla models has more than doubled every year since 2020. Non-Tesla EVs now represent approximately half of all new EV sales in the U.S. Used EV market share has more than tripled in the past three years.| EV Market Share Growth – iSeeCars Study | ||
| Month | New EV Market Share* | 1- to 5-Year Old Used EV Market Share** |
| Nov. 2020 | 0.5% | 0.6% |
| Nov. 2021 | 1.0% | 0.7% |
| Nov. 2022 | 2.3% | 1.1% |
| Nov. 2023 | 4.7% | 1.9% |
“Watch for a spike in used EV share as all these new models move into the used market,” said Brauer. “The inflation reduction act now offers up to a $4,000 incentive for used EVs, which will increase demand and market activity.”
Delaware, Rhode Island and Hawaii Lead in EV Dealers, Montana and Wyoming lag
While California has the highest percent of new EV market share, Delaware, Rhode Island, Hawaii, and Maine have a higher percentage of car dealers offering new EVs. Montana, Wyoming and Mississippi have the smallest percentage of new car EV dealers.| States With the Highest Percentage of New Car Dealers Selling EVs*: November 2023 – iSeeCars Study | |||
| Rank | State | Percentage of New Car Dealers Selling EVs | New EV Market Share |
| 1 | Delaware | 81.8% | 2.9% |
| 2 | Rhode Island | 75.0% | 3.9% |
| 3 | Hawaii | 71.4% | 8.3% |
| 4 | Maine | 68.8% | 4.2% |
| 5 | California | 65.3% | 12.2% |
| 6 | South Dakota | 64.7% | 1.6% |
| 7 | New Mexico | 63.8% | 4.2% |
| 8 | Oregon | 63.3% | 7.8% |
| 9 | Nebraska | 63.2% | 3.8% |
| 10 | Connecticut | 62.6% | 4.2% |
| States With the Lowest Percentage of New Car Dealers Selling EVs* | |||
| 39 | Texas | 48.4% | 3.5% |
| 40 | Iowa | 47.9% | 2.3% |
| 41 | Oklahoma | 45.8% | 2.0% |
| 42 | Kentucky | 44.7% | 2.3% |
| 43 | Arkansas | 42.5% | 2.1% |
| 44 | Idaho | 40.7% | 3.4% |
| 45 | Louisiana | 39.0% | 1.8% |
| 46 | Mississippi | 38.2% | 1.8% |
| 47 | Wyoming | 35.0% | 2.8% |
| 48 | Montana | 23.1% | 2.8% |
“Even states with the highest electric vehicle market share, including California and Oregon, don’t have anywhere close to 100 percent EV participation by dealers,” said Brauer.
Idaho and Montana go from zero to hero in new EV dealerships
Idaho and Montana had no indication of EV participation by new car dealerships in November 2020, but now they have over 40 percent and 23 percent, respectively, of new dealers selling EVs. West Virginia also saw massive growth from 3 percent to 50 percent in three years.
| States With the Highest Growth in New Car Dealers Selling EVs*: November 2020 vs. 2023 – iSeeCars Study | ||||
| Rank | State | Improvement | Percentage of New Car Dealers Selling EVs, 2023 | Percentage of New Car Dealers Selling EVs, 2020 |
| 1 | Idaho | -- | 40.7% | 0.0% |
| 2 | Montana | -- | 23.1% | 0.0% |
| 3 | West Virginia | 16.8x | 50.0% | 3.0% |
| 4 | Oklahoma | 11.1x | 45.8% | 4.1% |
| 5 | Arkansas | 8.3x | 42.5% | 5.1% |
| 6 | South Carolina | 8.0x | 59.7% | 7.5% |
| 7 | Mississippi | 6.1x | 38.2% | 6.3% |
| 8 | Louisiana | 6.0x | 39.0% | 6.5% |
| 9 | Kansas | 5.8x | 56.5% | 9.7% |
| 10 | Minnesota | 5.4x | 54.1% | 10.0% |
| States With the Lowest Percentage of New Car Dealers Selling EVs* | ||||
| 37 | New Hampshire | 2.8x | 61.8% | 21.7% |
| 38 | New Mexico | 2.8x | 63.8% | 22.5% |
| 39 | New York | 2.8x | 60.4% | 21.6% |
| 40 | Oregon | 2.5x | 63.3% | 25.8% |
| 41 | Vermont | 2.4x | 56.0% | 23.5% |
| 42 | Maryland | 2.3x | 62.1% | 26.6% |
| 43 | Connecticut | 2.2x | 62.6% | 28.4% |
| 44 | Massachusetts | 2.2x | 62.6% | 29.0% |
| 45 | California | 2.1x | 65.3% | 31.2% |
| 46 | Washington | 2.1x | 54.5% | 26.5% |
“It’s interesting to note that even states like Washington and California, with the lowest growth in new EV dealers, still more than doubled their share over the past three years,” said Brauer. “Most states now have more than 50 percent of new dealers selling EVs, with 15 states at or above 60 percent.”
California, Washington and Utah lead in used electric vehicle dealers
The percentage of used dealers selling electric vehicles hasn’t reached 50 percent yet, even in states like California and Washington that lead in used EV market share.| States With the Highest Percentage of Used Car Dealers Selling EVs*: November 2023 – iSeeCars Study | |||
| Rank | State | Percentage of Used Car Dealers Selling EVs | 1- to 5-Year Old Used EV Market Share |
| 1 | California | 47.6% | 5.3% |
| 2 | Washington | 45.2% | 4.9% |
| 3 | Utah | 43.1% | 2.8% |
| 4 | Colorado | 42.9% | 2.5% |
| 5 | Hawaii | 41.3% | 1.2% |
| 6 | Maryland | 41.0% | 2.5% |
| 7 | Nevada | 40.0% | 2.7% |
| 8 | Arizona | 39.6% | 2.7% |
| 9 | Oregon | 39.6% | 2.4% |
| 10 | Illinois | 36.1% | 2.3% |
| States With the Lowest Percentage of Used Car Dealers Selling EVs* | |||
| 41 | Montana | 20.3% | 0.2% |
| 42 | Kentucky | 19.4% | 0.7% |
| 43 | Arkansas | 18.6% | 0.8% |
| 44 | Alabama | 18.1% | 0.8% |
| 45 | South Dakota | 17.6% | 0.2% |
| 46 | Louisiana | 16.9% | 0.8% |
| 47 | West Virginia | 16.2% | 0.2% |
| 48 | North Dakota | 15.0% | 0.2% |
| 49 | Mississippi | 13.1% | 0.3% |
| 50 | Wyoming | 11.2% | 0.3% |
West Virginia, Mississippi and Wyoming have the fastest used EV dealer growth
West Virginia has grown its percentage of used EV dealers by more than 10 times in the past three years. Mississippi and Wyoming are ranked second and third, at 6.1 times and 4.3 times, respectively. Washington, California, Hawaii, and Oregon are approaching 50 percent used EV dealer share and have all seen about 1 percent growth.| States With the Highest Growth in Used Car Dealers Selling EVs*: November 2020 vs. 2023 – iSeeCars Study | ||||
| Rank | State | Improvement | Percentage of Used Car Dealers Selling EVs, 2023 | Percentage of Used Car Dealers Selling EVs, 2020 |
| 1 | West Virginia | 10.8x | 16.2% | 1.5% |
| 2 | Mississippi | 6.1x | 13.1% | 2.2% |
| 3 | Wyoming | 4.3x | 11.2% | 2.6% |
| 4 | Maine | 3.8x | 26.9% | 7.1% |
| 5 | South Carolina | 3.8x | 21.7% | 5.8% |
| 6 | Delaware | 3.5x | 25.8% | 7.4% |
| 7 | North Dakota | 3.5x | 15.0% | 4.3% |
| 8 | Louisiana | 3.4x | 16.9% | 5.0% |
| 9 | Wisconsin | 3.3x | 28.5% | 8.7% |
| 10 | Alabama | 3.2x | 18.1% | 5.6% |
| States With the Lowest Growth in Used Car Dealers Selling EVs* | ||||
| 41 | Idaho | 1.6x | 25.6% | 16.3% |
| 42 | Colorado | 1.5x | 42.9% | 28.3% |
| 43 | Utah | 1.4x | 43.1% | 30.6% |
| 44 | Nevada | 1.4x | 40.0% | 29.3% |
| 45 | Vermont | 1.3x | 30.7% | 22.7% |
| 46 | Arizona | 1.3x | 39.6% | 31.1% |
| 47 | Oregon | 1.1x | 39.6% | 35.4% |
| 48 | Hawaii | 1.1x | 41.3% | 36.9% |
| 49 | California | 1.1x | 47.6% | 42.6% |
| 50 | Washington | 1.0x | 45.2% | 44.1% |
“The electric vehicle transition will require cooperation across the automotive industry, with manufacturers, dealers, and state and local governments all supporting the effort,” said Brauer. “We don’t yet have 100 percent dealer participation in EV sales, but the numbers have improved dramatically over the past three years as more brands and more dealer groups support the sale of electric vehicles.”
New and used EV dealers and market share: Top 50 metro areas by population
These rankings show the 10 top and bottom metro areas based on the top 50 most populous metro areas. They are ranked by percent of new and used electric vehicle dealers and how much they’ve grown over the past three years.| Metro Areas With the Highest Percentage of New Car Dealers Selling EVs*: November 2023 – iSeeCars Study | |||
| Rank | Metro Area | Percentage of New Car Dealers Selling EVs | New EV Market Share |
| 1 | Milwaukee, WI | 72.5% | 2.6% |
| 2 | Portland, OR | 69.0% | 8.2% |
| 3 | Los Angeles, CA | 66.0% | 11.7% |
| 4 | Nashville, TN | 66.0% | 3.1% |
| 5 | Fresno-Visalia, CA | 64.7% | 5.8% |
| 6 | Kansas City, MO | 63.9% | 3.1% |
| 7 | Las Vegas, NV | 63.9% | 5.9% |
| 8 | Albuquerque-Santa Fe, NM | 63.6% | 4.4% |
| 9 | San Francisco-Oakland-San Jose, CA | 63.5% | 18.2% |
| 10 | Sacramento-Stockton-Modesto, CA | 63.3% | 9.5% |
| Metro Areas With the Lowest Percentage of New Car Dealers Selling EVs* | |||
| 41 | Cincinnati, OH | 48.2% | 3.0% |
| 42 | San Antonio, TX | 47.6% | 2.4% |
| 43 | Dallas-Ft. Worth, TX | 47.6% | 4.7% |
| 44 | Greenville-Spartanburg, SC | 47.1% | 2.7% |
| 45 | Louisville, KY | 45.5% | 2.8% |
| 46 | San Diego, CA | 43.3% | 10.1% |
| 47 | Austin, TX | 42.9% | 4.4% |
| 48 | Grand Rapids-Kalamazoo, MI | 42.5% | 3.2% |
| 49 | Oklahoma City, OK | 39.7% | 2.1% |
| 50 | Greensboro-Winston Salem, NC | 35.1% | 1.9% |
| Metro Areas With the Highest Growth in New Car Dealers Selling EVs*: November 2020 vs. 2023 – iSeeCars Study | ||||
| Rank | Metro Area | Improvement | Percentage of New Car Dealers Selling EVs, 2023 | Percentage of New Car Dealers Selling EVs, 2020 |
| 1 | St. Louis, MO | 7.3x | 60.5% | 8.3% |
| 2 | Harrisburg-Lancaster-York, PA | 6.6x | 58.1% | 8.8% |
| 3 | Birmingham, AL | 6.1x | 52.3% | 8.6% |
| 4 | Minneapolis-St. Paul, MN | 5.9x | 55.7% | 9.5% |
| 5 | Raleigh-Durham (Fayetteville), NC | 5.7x | 51.9% | 9.1% |
| 6 | Nashville, TN | 5.5x | 66.0% | 12.0% |
| 7 | Columbus, OH | 5.1x | 52.8% | 10.3% |
| 8 | Louisville, KY | 5.0x | 45.5% | 9.1% |
| 9 | Chicago, IL | 4.8x | 61.2% | 12.7% |
| 10 | Grand Rapids-Kalamazoo, MI | 4.8x | 42.5% | 8.8% |
| Metro Areas With the Lowest Growth in New Car Dealers Selling EVs* | ||||
| 41 | Salt Lake City, UT | 2.4x | 53.7% | 22.2% |
| 42 | Baltimore, MD | 2.4x | 58.5% | 24.7% |
| 43 | Greensboro-Winston Salem, NC | 2.2x | 35.1% | 16.0% |
| 44 | Hartford & New Haven, CT | 2.2x | 60.8% | 28.1% |
| 45 | Los Angeles, CA | 2.2x | 66.0% | 30.5% |
| 46 | Seattle-Tacoma, WA | 1.6x | 55.1% | 34.0% |
| 47 | Austin, TX | 1.5x | 42.9% | 28.9% |
| 48 | Cincinnati, OH | 1.5x | 48.2% | 32.7% |
| 49 | Fresno-Visalia, CA | 1.4x | 64.7% | 46.7% |
| 50 | San Diego, CA | 1.1x | 43.3% | 38.1% |
| Metro Areas With the Highest Percentage of Used Car Dealers Selling EVs*: November 2023 – -- iSeeCars Study | |||
| Rank | Metro Area | Percentage of Used Car Dealers Selling EVs | 1- to 5-Year Old Used EV Market Share |
| 1 | San Francisco-Oakland-San Jose, CA | 57.8% | 2.7% |
| 2 | Seattle-Tacoma, WA | 49.5% | 1.1% |
| 3 | Los Angeles, CA | 48.9% | 0.9% |
| 4 | San Diego, CA | 48.8% | 2.7% |
| 5 | Las Vegas, NV | 43.7% | 0.8% |
| 6 | Portland, OR | 43.1% | 1.3% |
| 7 | Denver, CO | 41.9% | 0.5% |
| 8 | Salt Lake City, UT | 41.0% | 0.2% |
| 9 | West Palm Beach-Ft. Pierce, FL | 40.8% | 2.4% |
| 10 | Washington, DC (Hagerstown, MD) | 40.7% | 1.7% |
| Metro Areas With the Lowest Percentage of Used Car Dealers Selling EVs* | |||
| 41 | Cleveland-Akron (Canton), OH | 25.4% | 0.8% |
| 42 | Charlotte, NC | 25.3% | 0.7% |
| 43 | Grand Rapids-Kalamazoo, MI | 25.0% | 4.9% |
| 44 | Greensboro-Winston Salem, NC | 24.0% | 2.5% |
| 45 | Oklahoma City, OK | 23.9% | 2.0% |
| 46 | Pittsburgh, PA | 23.4% | 1.2% |
| 47 | Detroit, MI | 22.8% | 0.7% |
| 48 | Nashville, TN | 22.2% | 0.9% |
| 49 | Birmingham, AL | 21.1% | 1.5% |
| 50 | Greenville-Spartanburg, SC | 20.7% | 1.2% |
| Metro Areas With the Highest Growth in Used Car Dealers Selling EVs*: November 2020 vs. 2023 – iSeeCars Study | ||||
| Rank | State | Improvement | Percentage of Used Car Dealers Selling EVs, 2023 | Percentage of Used Car Dealers Selling EVs, 2020 |
| 1 | Pittsburgh, PA | 4.5x | 23.4% | 5.2% |
| 2 | Birmingham, AL | 4.1x | 21.1% | 5.2% |
| 3 | Milwaukee, WI | 3.4x | 31.0% | 9.2% |
| 4 | Harrisburg-Lancaster-York, PA | 2.8x | 27.7% | 9.9% |
| 5 | Grand Rapids-Kalamazoo, MI | 2.7x | 25.0% | 9.2% |
| 6 | Louisville, KY | 2.6x | 26.4% | 10.1% |
| 7 | St. Louis, MO | 2.6x | 25.6% | 9.8% |
| 8 | Oklahoma City, OK | 2.6x | 23.9% | 9.1% |
| 9 | Hartford & New Haven, CT | 2.5x | 28.1% | 11.1% |
| 10 | Norfolk-Portsmouth-Newport News,VA | 2.5x | 25.4% | 10.3% |
| Metro Areas With the Lowest Growth in Used Car Dealers Selling EVs* | ||||
| 41 | Columbus, OH | 1.3x | 26.5% | 20.0% |
| 42 | Phoenix, AZ | 1.2x | 40.5% | 33.0% |
| 43 | San Diego, CA | 1.2x | 48.8% | 40.2% |
| 44 | Portland, OR | 1.2x | 43.1% | 35.7% |
| 45 | Los Angeles, CA | 1.2x | 48.9% | 42.2% |
| 46 | San Francisco-Oakland-San Jose, CA | 1.1x | 57.8% | 55.0% |
| 47 | Austin, TX | 1x | 35.3% | 33.8% |
| 48 | Fresno-Visalia, CA | 1x | 36.2% | 36.1% |
| 49 | Sacramento-Stockton-Modesto, CA | 1x | 38.6% | 38.6% |
| 50 | Seattle-Tacoma, WA | 1x | 49.5% | 49.7% |
Methodology
iSeeCars analyzed the inventories of over 82,000 new and used car dealers from November 2020 to November 2023 by month. Low volume dealers were excluded from the analysis, as were new and used cars sold directly from Tesla showrooms/Tesla online. The number of dealers who offered at least one EV for sale in a given month was tallied and expressed as a percentage of dealers selling cars for the month. The analysis was repeated for each US state and the 50 most populous metro areas. The market share of new and used EVs (excluding new Teslas) was also calculated for each market.
About iSeeCars.com

