
Best Used 7-Seater SUVs Under $15k for 2026
The best used 7-seater SUVs under $15k based on a data-driven analysis of each vehicle's reliability, resale value and safety.
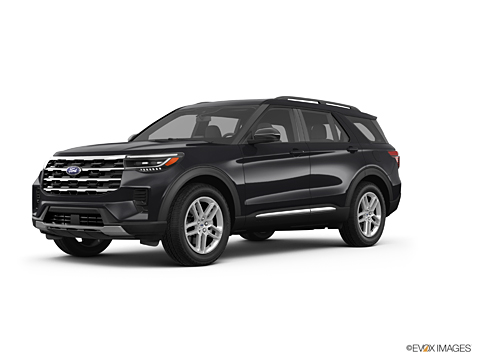
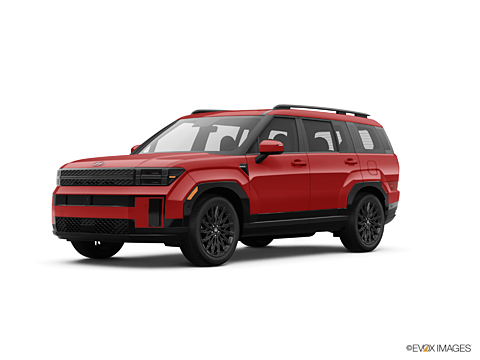
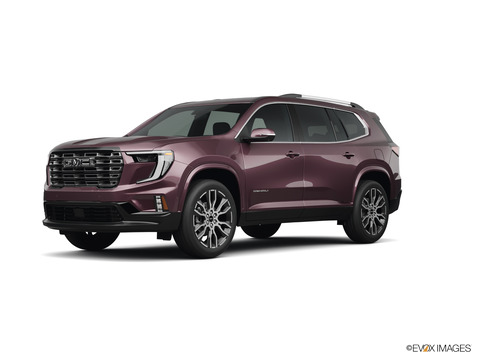
The best used 7-seater SUV under $15,000 is the 2017 Ford Explorer based on our analysis of 12 million vehicles to assess their reliability, resale value and safety. The 2017 Ford Explorer has an average price of $14,902 with an overall iSeeCars score of 8.2. Behind the Explorer is the 2017 Hyundai SANTA FE with average used car price of $13,328 and iSeeCars score of 8.2. The number 3 best used 7-seater SUV under $15,000 is the 2016 GMC Acadia at $11,874 average price and 7.9 iSeeCars rating. For this analysis, iSeeCars looked at used 7-seater SUVs under $15k that are 1 to 10 years old to determine the latest model year vehicles that are within the price range of $10,000 to $15,000.

The best used 7-seater SUV under $15,000 is the 2017 Ford Explorer based on our analysis of 12 million vehicles to assess their reliability, resale value and safety. The 2017 Ford Explorer has an average price of $14,902 with an overall iSeeCars score of 8.2. Behind the Explorer is the 2017 Hyundai SANTA FE with average used car price of $13,328 and iSeeCars score of 8.2. The number 3 best used 7-seater SUV under $15,000 is the 2016 GMC Acadia at $11,874 average price and 7.9 iSeeCars rating. For this analysis, iSeeCars looked at used 7-seater SUVs under $15k that are 1 to 10 years old to determine the latest model year vehicles that are within the price range of $10,000 to $15,000.
-
 iSeeCars Score:
8.2
/ 10
iSeeCars Score:
8.2
/ 10
- Average Used Car Price: 14902.297518

 iSEECARS SCORE

iSeeCars Best Car Rankings are calculated based on an analysis of data from over 12 million cars that assesses how long each vehicle lasts and how well it retains its value over time, along with safety data from the National Highway Traffic Safety Association
See how we rank these cars
-
Reliability
7.3
/ 10
-
Value Retention
7.4
/ 10
-
Safety
10
/ 10

-
iSeeCars Score:
8.2
/ 10
- Average Used Car Price: 13328.336663
iSEECARS SCORE
iSeeCars Best Car Rankings are calculated based on an analysis of data from over 12 million cars that assesses how long each vehicle lasts and how well it retains its value over time, along with safety data from the National Highway Traffic Safety Association
See how we rank these cars
-
Reliability
7.2
/ 10
-
Value Retention
7.7
/ 10
-
Safety
9.7
/ 10
-
iSeeCars Score:
7.9
/ 10
- Average Used Car Price: 11873.649718
iSEECARS SCORE
iSeeCars Best Car Rankings are calculated based on an analysis of data from over 12 million cars that assesses how long each vehicle lasts and how well it retains its value over time, along with safety data from the National Highway Traffic Safety Association
See how we rank these cars
-
Reliability
7.1
/ 10
-
Value Retention
7.5
/ 10
-
Safety
9.0
/ 10
-
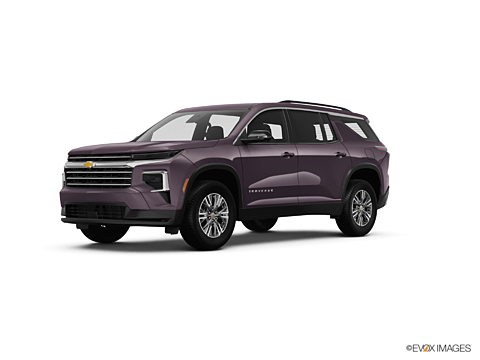
iSeeCars Score:
7.7
/ 10
- Average Used Car Price: 12054.66551
iSEECARS SCORE
iSeeCars Best Car Rankings are calculated based on an analysis of data from over 12 million cars that assesses how long each vehicle lasts and how well it retains its value over time, along with safety data from the National Highway Traffic Safety Association
See how we rank these cars
-
Reliability
6.8
/ 10
-
Value Retention
7.5
/ 10
-
Safety
8.8
/ 10
5. 2016 Mazda CX-9
-
iSeeCars Score:
7.6
/ 10
- Average Used Car Price: 14594.412587
iSEECARS SCORE
iSeeCars Best Car Rankings are calculated based on an analysis of data from over 12 million cars that assesses how long each vehicle lasts and how well it retains its value over time, along with safety data from the National Highway Traffic Safety Association
See how we rank these cars
-
Reliability
7.3
/ 10
-
Value Retention
7.6
/ 10
-
Safety
8.0
/ 10

-
iSeeCars Score:
7.6
/ 10
- Average Used Car Price: 13509.720971
iSEECARS SCORE
iSeeCars Best Car Rankings are calculated based on an analysis of data from over 12 million cars that assesses how long each vehicle lasts and how well it retains its value over time, along with safety data from the National Highway Traffic Safety Association
See how we rank these cars
-
Reliability
6.8
/ 10
-
Value Retention
7.5
/ 10
-
Safety
8.5
/ 10
-
iSeeCars Score:
7.3
/ 10
- Average Used Car Price: 14163.411168
iSEECARS SCORE
iSeeCars Best Car Rankings are calculated based on an analysis of data from over 12 million cars that assesses how long each vehicle lasts and how well it retains its value over time, along with safety data from the National Highway Traffic Safety Association
See how we rank these cars
-
Reliability
7.2
/ 10
-
Value Retention
7.7
/ 10
-
Safety
7.0
/ 10
-
iSeeCars Score:
7.3
/ 10
- Average Used Car Price: 13388.809339
iSEECARS SCORE
iSeeCars Best Car Rankings are calculated based on an analysis of data from over 12 million cars that assesses how long each vehicle lasts and how well it retains its value over time, along with safety data from the National Highway Traffic Safety Association
See how we rank these cars
-
Reliability
7.2
/ 10
-
Value Retention
7.6
/ 10
-
Safety
7.1
/ 10
Related Rankings


How We Rank These Cars
iSeeCars Best Used Cars Under $15k Rankings are calculated based on the latest research by our data science team and the National Highway Traffic Safety Administration (NHTSA).
We analyze data from over 12 million new and used vehicles in our Longest-Lasting Cars and 5-Year Depreciation Studies, combined with the NHTSA's Safety Ratings to give you an unbiased guide to the best vehicles in each segment.
After being evaluated, vehicles with the highest average scores earn a spot in the iSeeCars Best Car Rankings. (No final score is given to vehicles missing a score in any of the categories, but scores for other categories are still shown.)
Vehicles are scored in three categories:

Reliability
The reliability score represents an analysis of iSeeCars' proprietary research on the longest-lasting vehicles.

Value Retention
The value retention score is based on our data science team's statistical analysis and prediction of 5-year depreciation from MSRP to determine which cars hold their value best, using US Bureau of Labor Statistics data to adjust for inflation.

Safety
The safety score is calculated based on the last five years of crash test ratings from the National Highway Traffic Safety Administration (NHTSA) and incorporates the latest Top Safety Pick information from the Insurance Institute for Highway Safety (IIHS).