Best Performance Luxury SUVs for 2026
These are the best performance luxury SUVs based on iSeeCars' analysis of each vehicle's power to weight ratio

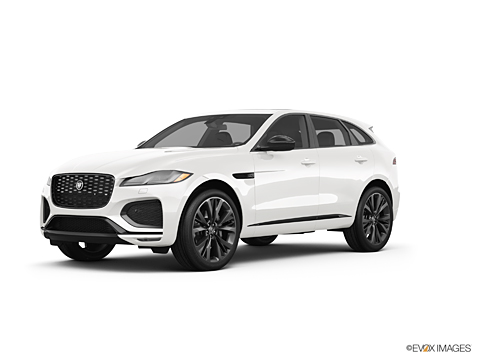
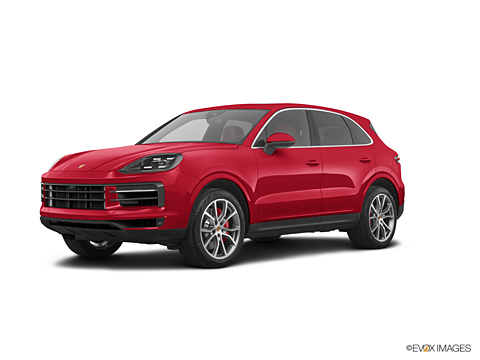
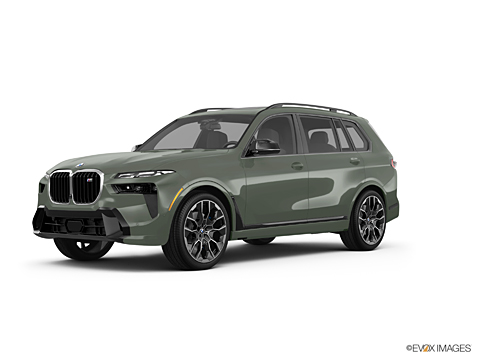
The best performance luxury small and compact SUV is the Jaguar F-PACE (8.0 weight-to-horsepower ratio), with the Porsche Cayenne being the best performance luxury midsize SUV (7.8 weight-to-horsepower ratio). The BMW X7 ranks #1 for the best performance luxury large SUVs (9.5 weight-to-horsepower ratio).
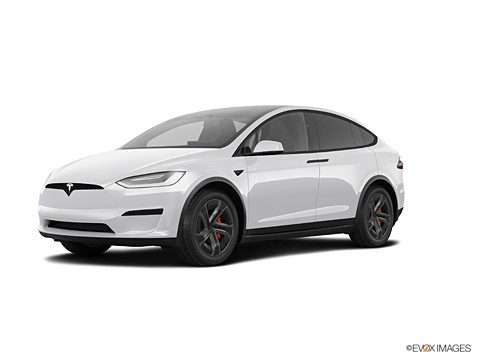
The best performance luxury crossover SUV is the Porsche Cayenne (7.8 weight-to-horsepower ratio), with the Land Rover Defender being the best performance luxury three-row SUV (9.3 weight-to-horsepower ratio). The Tesla Model X ranks #1 for the best performance luxury electric SUVs (5.3 weight-to-horsepower ratio).


How We Rank These Cars
The best performance cars rank vehicles by their weight-to-horsepower ratio.
The weight-to-horsepower ratio is calculated based on a vehicle's curb weight and horsepower at the trim level - the less weight one horsepower has to pull, the better performance a vehicle can provide. For cars with a ratio within 0.1 of each other, lighter vehicles always have the advantage in performance and are ranked to reflect that. For each vehicle, we also show the iSeeCars Score which rates the overall quality of a vehicle.
The iSeeCars Score is an analysis of three factors: reliability, resale value and safety. It is calculated based on the latest research and analysis by our data science team. The data analysis comes from over 12 million new and used vehicles in our Longest-Lasting Cars and 5-Year Depreciation Studies, combined with NHTSA and IIHS Safety Ratings.
Vehicles are scored in three categories:

Reliability
The reliability score represents an analysis of iSeeCars' proprietary research on the longest-lasting vehicles.

Value Retention
The value retention score is based on our data science team's statistical analysis and prediction of 5-year depreciation from MSRP to determine which cars hold their value best, using US Bureau of Labor Statistics data to adjust for inflation.

Safety
The safety score is calculated based on the last five years of crash test ratings from the National Highway Traffic Safety Administration (NHTSA) and incorporates the latest Top Safety Pick information from the Insurance Institute for Highway Safety (IIHS).