
Best Nissan SUVs for 2026
These are the best Nissan SUVs ranked by how well each vehicle performs in its own category based on iSeeCars' analysis of its reliability, resale value and safety.
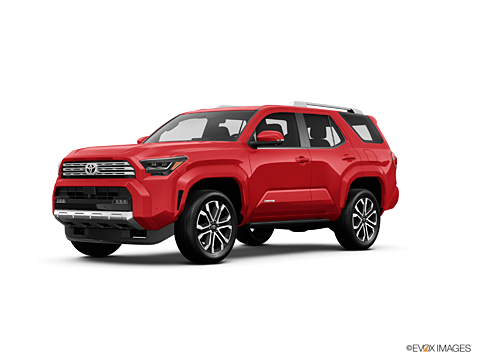
Nissan’s best SUV is the Nissan Murano, with an iSeeCars Quality Score of 8.2 out of 10. This score is reflected in the Nissan Murano suv non-hybrid/electric being ranked #3 for Best Midsize SUVs, which is the highest overall ranking for any Nissan SUV. Additional Nissan Murano suv non-hybrid/electric rankings include #1 for Best Family Crossover SUVs, #1 for Safest Crossover SUVs, and #1 for Best Family 5-seater SUVs.
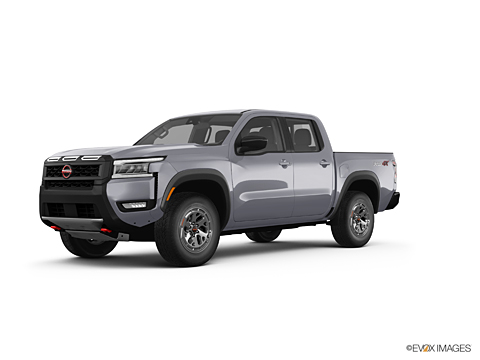
Nissan’s second-best SUV is the Nissan Pathfinder, with an iSeeCars Quality Score of 8.2 out of 10. This score is reflected in the Nissan Pathfinder suv non-hybrid/electric being ranked #3 for Best 8-seater SUVs, which is the highest overall ranking for any Nissan SUV. Additional Nissan Pathfinder suv non-hybrid/electric rankings include #1 for Best Family SUVs with 3 Rows, #1 for Best Family 8-seater SUVs, and #1 for Most Affordable 8-seater SUVs.

Nissan’s best SUV is the Nissan Murano, with an iSeeCars Quality Score of 8.2 out of 10. This score is reflected in the Nissan Murano suv non-hybrid/electric being ranked #3 for Best Midsize SUVs, which is the highest overall ranking for any Nissan SUV. Additional Nissan Murano suv non-hybrid/electric rankings include #1 for Best Family Crossover SUVs, #1 for Safest Crossover SUVs, and #1 for Best Family 5-seater SUVs.
Nissan’s second-best SUV is the Nissan Pathfinder, with an iSeeCars Quality Score of 8.2 out of 10. This score is reflected in the Nissan Pathfinder suv non-hybrid/electric being ranked #3 for Best 8-seater SUVs, which is the highest overall ranking for any Nissan SUV. Additional Nissan Pathfinder suv non-hybrid/electric rankings include #1 for Best Family SUVs with 3 Rows, #1 for Best Family 8-seater SUVs, and #1 for Most Affordable 8-seater SUVs.
-
 Category Ranking
#3
of 31
Category Ranking
#3
of 31
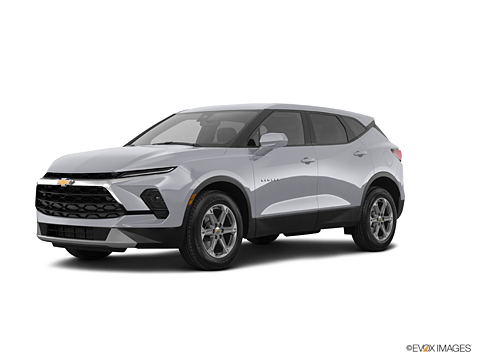
- Best Midsize SUVs

 iSEECARS SCORE

iSeeCars Best Car Rankings are calculated based on an analysis of data from over 12 million cars that assesses how long each vehicle lasts and how well it retains its value over time, along with safety data from the National Highway Traffic Safety Association
See how we rank these cars
-
Reliability
7.4
/ 10
-
Value Retention
7.3
/ 10
-
Safety
10
/ 10
-
Category Ranking
#3
of 20
- Best 8-seater SUVs
iSEECARS SCORE
iSeeCars Best Car Rankings are calculated based on an analysis of data from over 12 million cars that assesses how long each vehicle lasts and how well it retains its value over time, along with safety data from the National Highway Traffic Safety Association
See how we rank these cars
-
Reliability
7.2
/ 10
-
Value Retention
7.3
/ 10
-
Safety
10
/ 10

-
Category Ranking
#3
of 12
- Best Large SUVs
iSEECARS SCORE
iSeeCars Best Car Rankings are calculated based on an analysis of data from over 12 million cars that assesses how long each vehicle lasts and how well it retains its value over time, along with safety data from the National Highway Traffic Safety Association
See how we rank these cars
-
Reliability
6.8
/ 10
-
Value Retention
7.0
/ 10
-
Safety
9.0
/ 10
-
Category Ranking
#11
of 19
- Best Small SUVs
iSEECARS SCORE
iSeeCars Best Car Rankings are calculated based on an analysis of data from over 12 million cars that assesses how long each vehicle lasts and how well it retains its value over time, along with safety data from the National Highway Traffic Safety Association
See how we rank these cars
-
Reliability
7.2
/ 10
-
Value Retention
7.7
/ 10
-
Safety
7.6
/ 10


Other Popular Lists

How We Rank These Cars
iSeeCars Best Car Rankings are calculated based on the latest research by our data science team and the National Highway Traffic Safety Administration (NHTSA).
We analyze data from over 12 million new and used vehicles in our Longest-Lasting Cars and 5-Year Depreciation Studies, combined with the NHTSA's Safety Ratings to give you an unbiased guide to the best vehicles in each segment.
After being evaluated, vehicles with the highest average scores earn a spot in the iSeeCars Best Car Rankings. (No final score is given to vehicles missing a score in any of the categories, but scores for other categories are still shown.)
Vehicles are scored in three categories:

Reliability
The reliability score represents an analysis of iSeeCars' proprietary research on the longest-lasting vehicles.

Value Retention
The value retention score is based on our data science team's statistical analysis and prediction of 5-year depreciation from MSRP to determine which cars hold their value best, using US Bureau of Labor Statistics data to adjust for inflation.

Safety
The safety score is calculated based on the last five years of crash test ratings from the National Highway Traffic Safety Administration (NHTSA) and incorporates the latest Top Safety Pick information from the Insurance Institute for Highway Safety (IIHS).