
Most Affordable Luxury Convertibles for 2026
The most affordable new luxury convertibles are ranked based on our analysis of their lowest base prices, though local market conditions might push a specific model’s price above the starting MSRP for vehicles in short supply or with high demand.
The most affordable luxury convertible is the BMW Z4 convertible non-hybrid/electric, with a starting price of $56,100 based on iSeecars.com’s affordability ranking of 12 luxury convertibles. The most affordable luxury convertibles offer the lowest starting price for their base trim level. The average starting price for a luxury convertible is $99,812, and there are 6 luxury convertibles that are cheaper.
The luxury convertible affordability ranking is calculated based on the starting price for the lowest-priced trim level of a given model. The overall iSeeCars Score also factors into the ranking of each vehicle. Shoppers seeking the most affordable luxury convertible should consider costs beyond the purchase price, including residual value, insurance, fuel efficiency, and maintenance, to fully understand how much a specific luxury convertible will cost to own and operate.
-
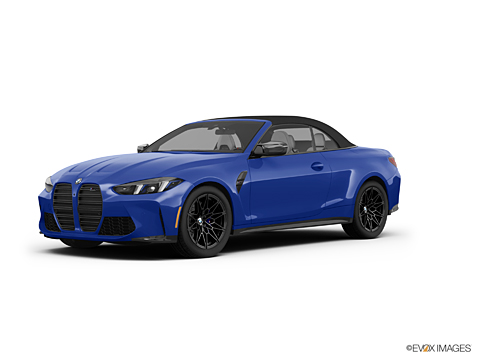
 Starting MSRP
56100
Starting MSRP
56100

 iSEECARS SCORE

iSeeCars Best Car Rankings are calculated based on an analysis of data from over 12 million cars that assesses how long each vehicle lasts and how well it retains its value over time, along with safety data from the National Highway Traffic Safety Association
See how we rank these cars
-
Reliability
7.1
/ 10
-
Value Retention
7.8
/ 10
-
Safety
Not Available

-
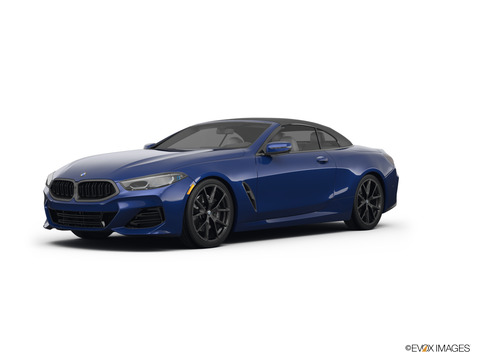
Starting MSRP
61300
iSEECARS SCORE
iSeeCars Best Car Rankings are calculated based on an analysis of data from over 12 million cars that assesses how long each vehicle lasts and how well it retains its value over time, along with safety data from the National Highway Traffic Safety Association
See how we rank these cars
-
Reliability
6.7
/ 10
-
Value Retention
7.7
/ 10
-
Safety
Not Available

-
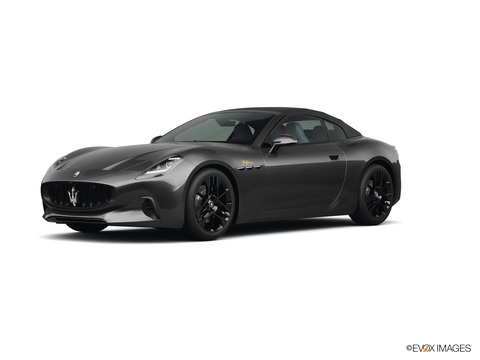
Starting MSRP
68050
iSEECARS SCORE
iSeeCars Best Car Rankings are calculated based on an analysis of data from over 12 million cars that assesses how long each vehicle lasts and how well it retains its value over time, along with safety data from the National Highway Traffic Safety Association
See how we rank these cars
-
Reliability
Coming soon
-
Value Retention
8.0
/ 10
-
Safety
Not Available

-
Starting MSRP
74900
iSEECARS SCORE
iSeeCars Best Car Rankings are calculated based on an analysis of data from over 12 million cars that assesses how long each vehicle lasts and how well it retains its value over time, along with safety data from the National Highway Traffic Safety Association
See how we rank these cars
-
Reliability
Coming soon
-
Value Retention
9.2
/ 10
-
Safety
Not Available

-
Starting MSRP
77000
iSEECARS SCORE
iSeeCars Best Car Rankings are calculated based on an analysis of data from over 12 million cars that assesses how long each vehicle lasts and how well it retains its value over time, along with safety data from the National Highway Traffic Safety Association
See how we rank these cars
-
Reliability
8.4
/ 10
-
Value Retention
8.8
/ 10
-
Safety
Not Available

-
Starting MSRP
98400
iSEECARS SCORE
iSeeCars Best Car Rankings are calculated based on an analysis of data from over 12 million cars that assesses how long each vehicle lasts and how well it retains its value over time, along with safety data from the National Highway Traffic Safety Association
See how we rank these cars
-
Reliability
7.5
/ 10
-
Value Retention
7.8
/ 10
-
Safety
Not Available
-
Starting MSRP
104500
iSEECARS SCORE
iSeeCars Best Car Rankings are calculated based on an analysis of data from over 12 million cars that assesses how long each vehicle lasts and how well it retains its value over time, along with safety data from the National Highway Traffic Safety Association
See how we rank these cars
-
Reliability
Coming soon
-
Value Retention
7.5
/ 10
-
Safety
Not Available
-
Starting MSRP
108550
iSEECARS SCORE
iSeeCars Best Car Rankings are calculated based on an analysis of data from over 12 million cars that assesses how long each vehicle lasts and how well it retains its value over time, along with safety data from the National Highway Traffic Safety Association
See how we rank these cars
-
Reliability
Coming soon
-
Value Retention
8.4
/ 10
-
Safety
Not Available

-
Starting MSRP
112550
iSEECARS SCORE
iSeeCars Best Car Rankings are calculated based on an analysis of data from over 12 million cars that assesses how long each vehicle lasts and how well it retains its value over time, along with safety data from the National Highway Traffic Safety Association
See how we rank these cars
-
Reliability
7.4
/ 10
-
Value Retention
7.9
/ 10
-
Safety
Not Available

-
Starting MSRP
133400
iSEECARS SCORE
iSeeCars Best Car Rankings are calculated based on an analysis of data from over 12 million cars that assesses how long each vehicle lasts and how well it retains its value over time, along with safety data from the National Highway Traffic Safety Association
See how we rank these cars
-
Reliability
8.9
/ 10
-
Value Retention
9.3
/ 10
-
Safety
Not Available

-
Starting MSRP
150000
iSEECARS SCORE
iSeeCars Best Car Rankings are calculated based on an analysis of data from over 12 million cars that assesses how long each vehicle lasts and how well it retains its value over time, along with safety data from the National Highway Traffic Safety Association
See how we rank these cars
-
Reliability
Coming soon
-
Value Retention
7.5
/ 10
-
Safety
Not Available

-
Starting MSRP
153000
iSEECARS SCORE
iSeeCars Best Car Rankings are calculated based on an analysis of data from over 12 million cars that assesses how long each vehicle lasts and how well it retains its value over time, along with safety data from the National Highway Traffic Safety Association
See how we rank these cars
-
Reliability
Coming soon
-
Value Retention
7.7
/ 10
-
Safety
Not Available
Related Rankings


How We Rank These Cars
The Most Affordable Car lists rank vehicles by their starting MSRP.
Starting MSRP is the lowest MSRP across all trims for a given new car model. In the event there is a tie, we use iSeeCars proprietary rating of the overall quality of the car (iSeeCars Score) to break the tie.
The overall iSeeCars Score is an analysis of three factors: reliability, resale value and safety. It is calculated based on the latest research and analysis by our data science team. The data analysis comes from over 12 million new and used vehicles in our Longest-Lasting Cars and 5-Year Depreciation Studies, combined with NHTSA and IIHS Safety Ratings.
Vehicles are scored in three categories:

Reliability
The reliability score represents an analysis of iSeeCars' proprietary research on the longest-lasting vehicles.

Value Retention
The value retention score is based on our data science team's statistical analysis and prediction of 5-year depreciation from MSRP to determine which cars hold their value best, using US Bureau of Labor Statistics data to adjust for inflation.

Safety
The safety score is calculated based on the last five years of crash test ratings from the National Highway Traffic Safety Administration (NHTSA) and incorporates the latest Top Safety Pick information from the Insurance Institute for Highway Safety (IIHS).